suppressPackageStartupMessages({
    library(tidyverse)
    library(cowplot)
    library(ggpointdensity)
    library(ggdensity)
    theme_set(theme_cowplot())
})
options(repr.plot.width=16,repr.plot.height=10)
Density 2D#
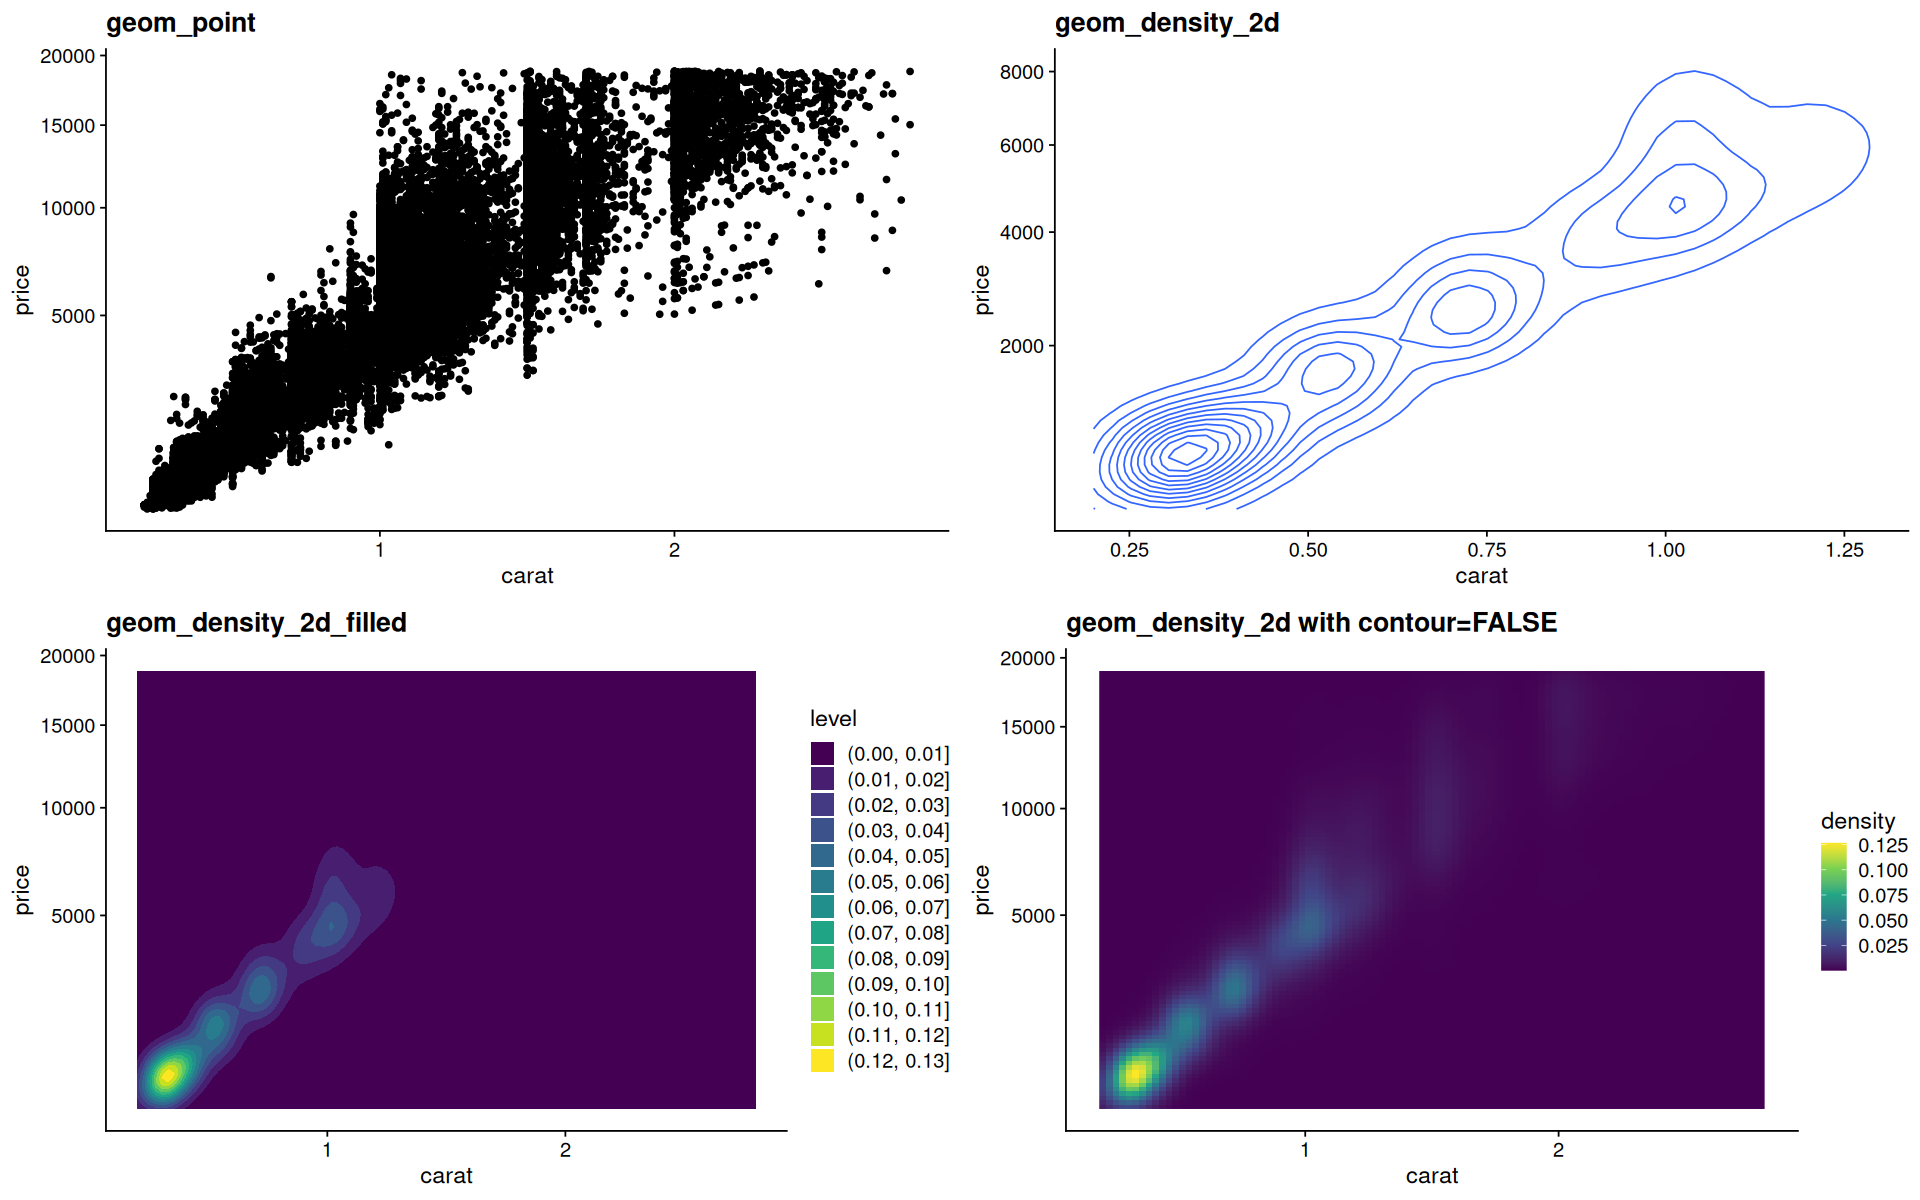
p <-
diamonds |>
filter(carat<3) |>
ggplot(aes(x=carat, y=price)) +
scale_y_sqrt()
p1 <- p + geom_point() + ggtitle('geom_point')
p2 <- p + geom_density_2d() + ggtitle('geom_density_2d')
p3 <- p + geom_density_2d_filled() + ggtitle('geom_density_2d_filled')
p4 <- p + stat_density_2d(geom='raster', aes(fill = after_stat(density)), contour=FALSE) + scale_fill_viridis_c() + ggtitle('geom_density_2d with contour=FALSE')
plot_grid(p1,p2,p3,p4)
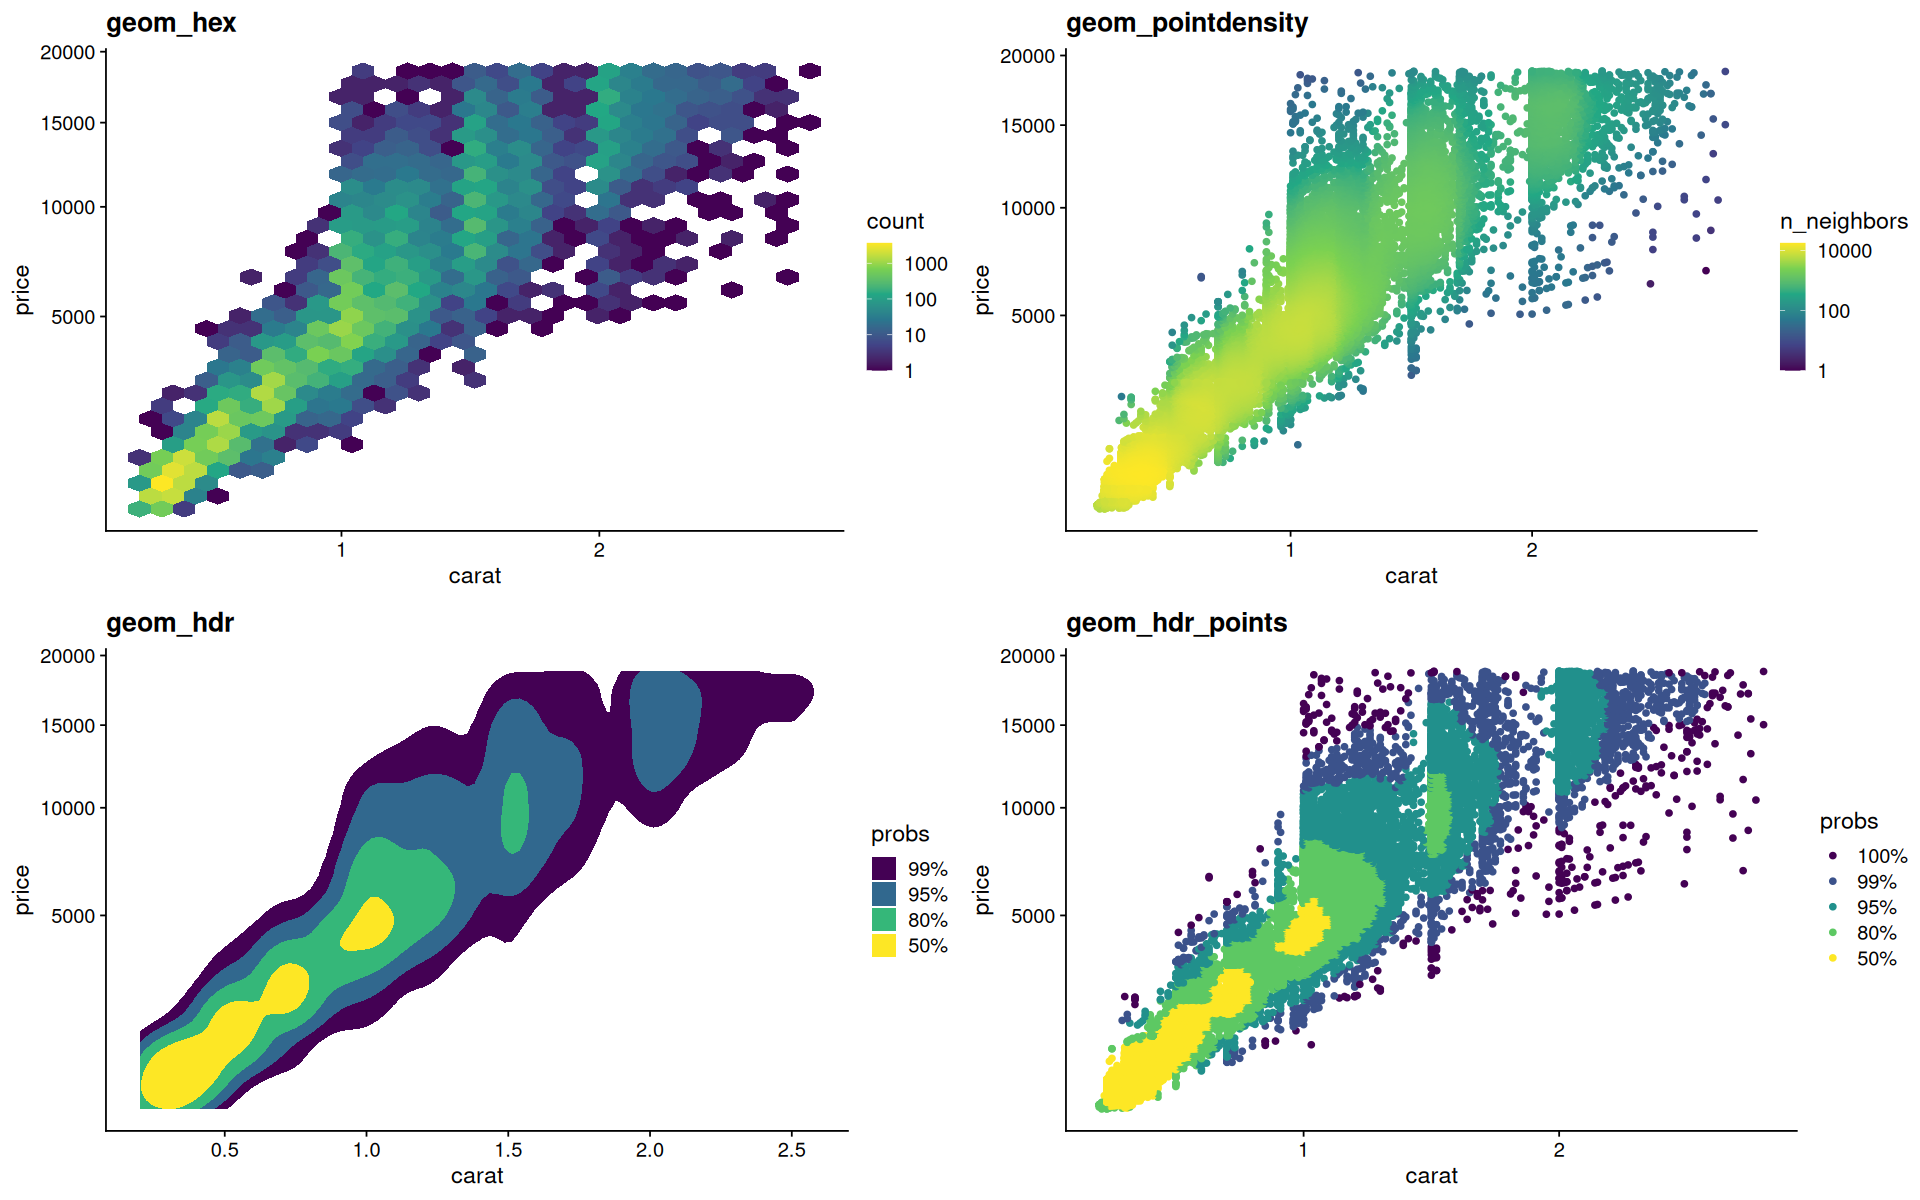
p1 <- p + geom_hex() + scale_fill_viridis_c(trans='log10') + ggtitle('geom_hex')
p2 <- p + geom_pointdensity() + scale_color_viridis_c(trans='log10') + ggtitle('geom_pointdensity')
p3 <- p + geom_hdr(aes(fill=after_stat(probs)),alpha=1) + ggtitle('geom_hdr')
p4 <- p + geom_hdr_points() + ggtitle('geom_hdr_points')
plot_grid(p1,p2,p3,p4)