suppressPackageStartupMessages({
    library(tidyverse)
    library(cowplot)
    library(ggbeeswarm)
    library(ggdist)
    library(ggridges)
    theme_set(theme_cowplot())
})
options(repr.plot.width=16,repr.plot.height=10)
Density 1D#
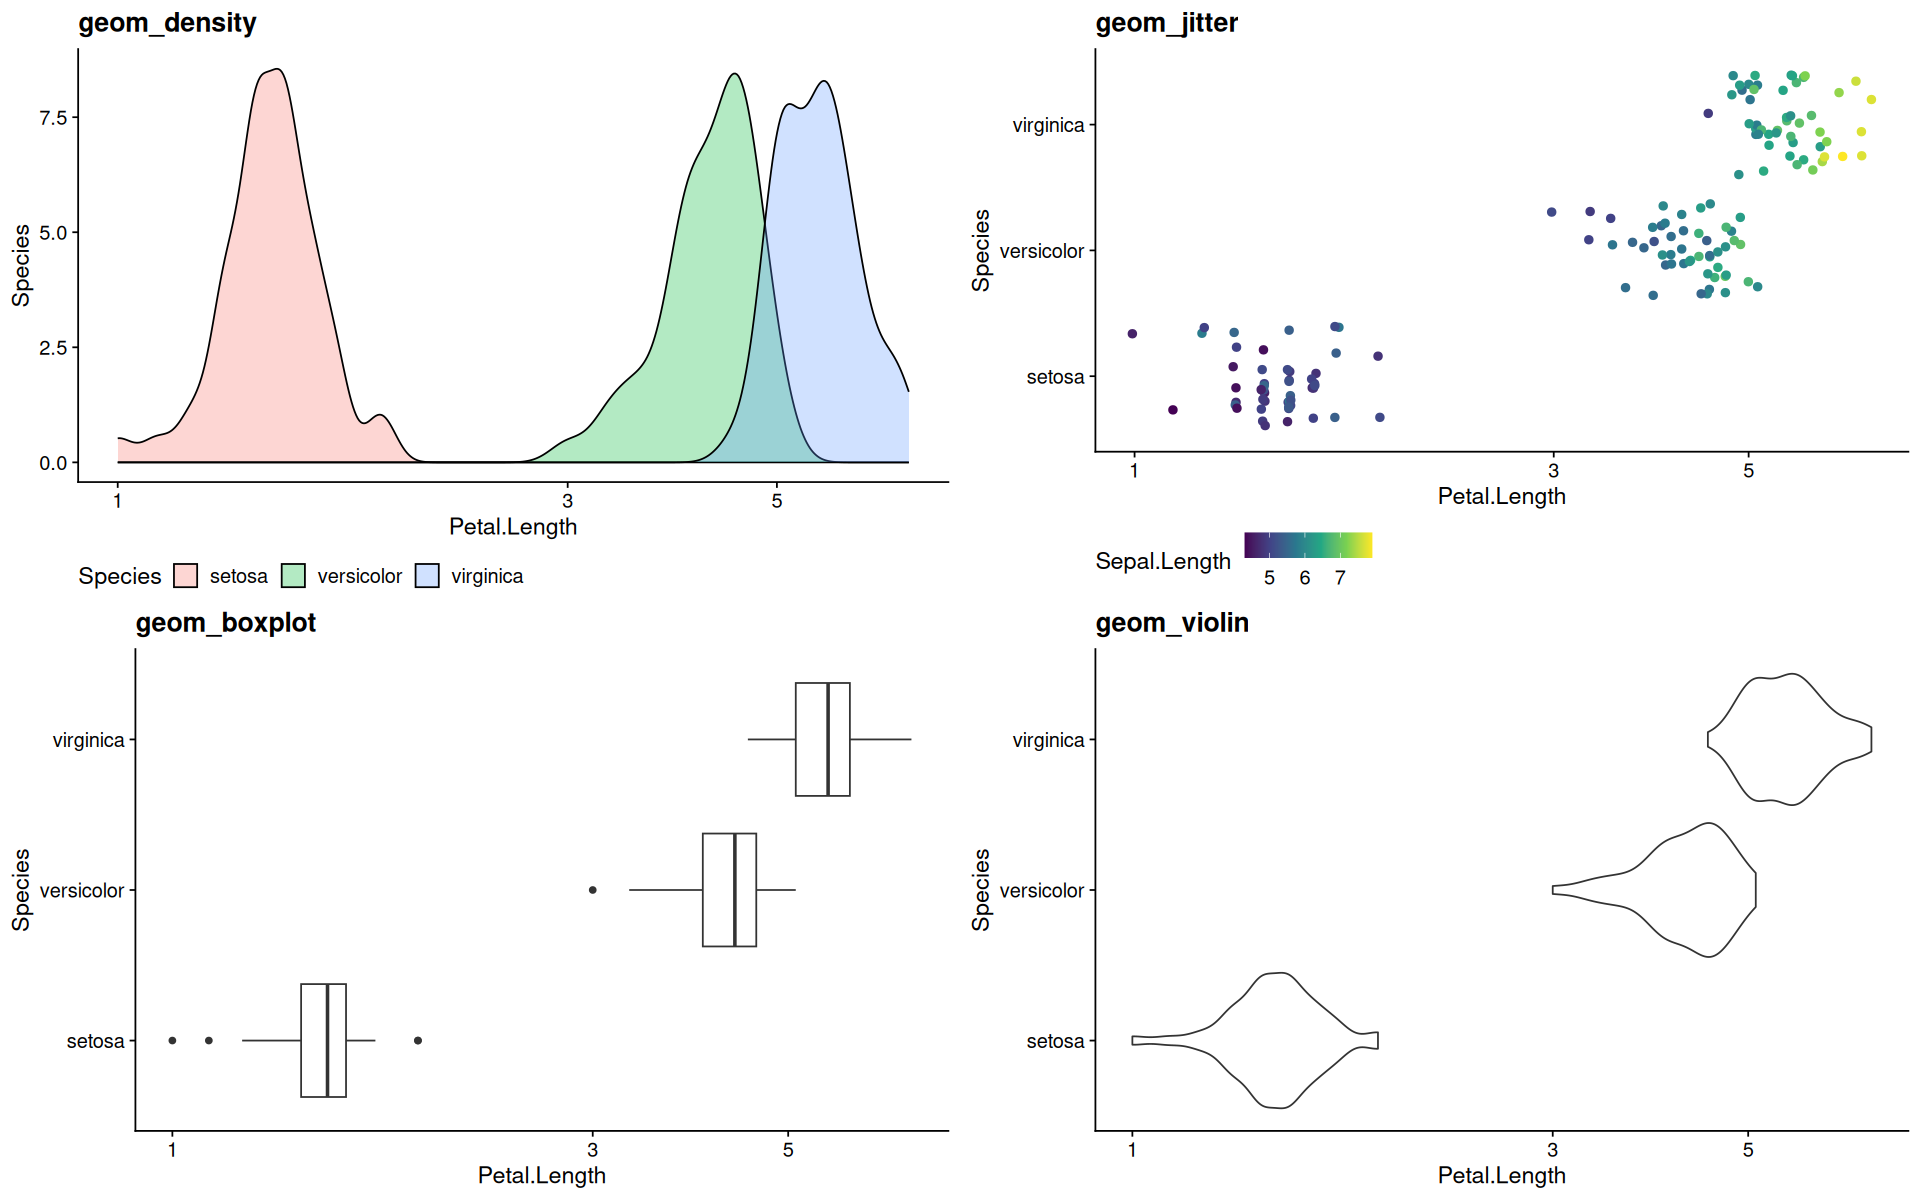
p <- ggplot(iris, aes(y=Species, x=Petal.Length)) +
scale_x_log10() +
theme(legend.position='bottom')
p1 <- p + geom_density(inherit.aes = FALSE, aes(fill=Species,x=Petal.Length),alpha=0.3) + ggtitle('geom_density')
p2 <- p + geom_jitter(aes(color=Sepal.Length),size=2) + scale_color_viridis_c() + ggtitle('geom_jitter')
p3 <- p + geom_boxplot() + ggtitle('geom_boxplot')
p4 <- p + geom_violin() + ggtitle('geom_violin')
plot_grid(p1,p2,p3,p4)
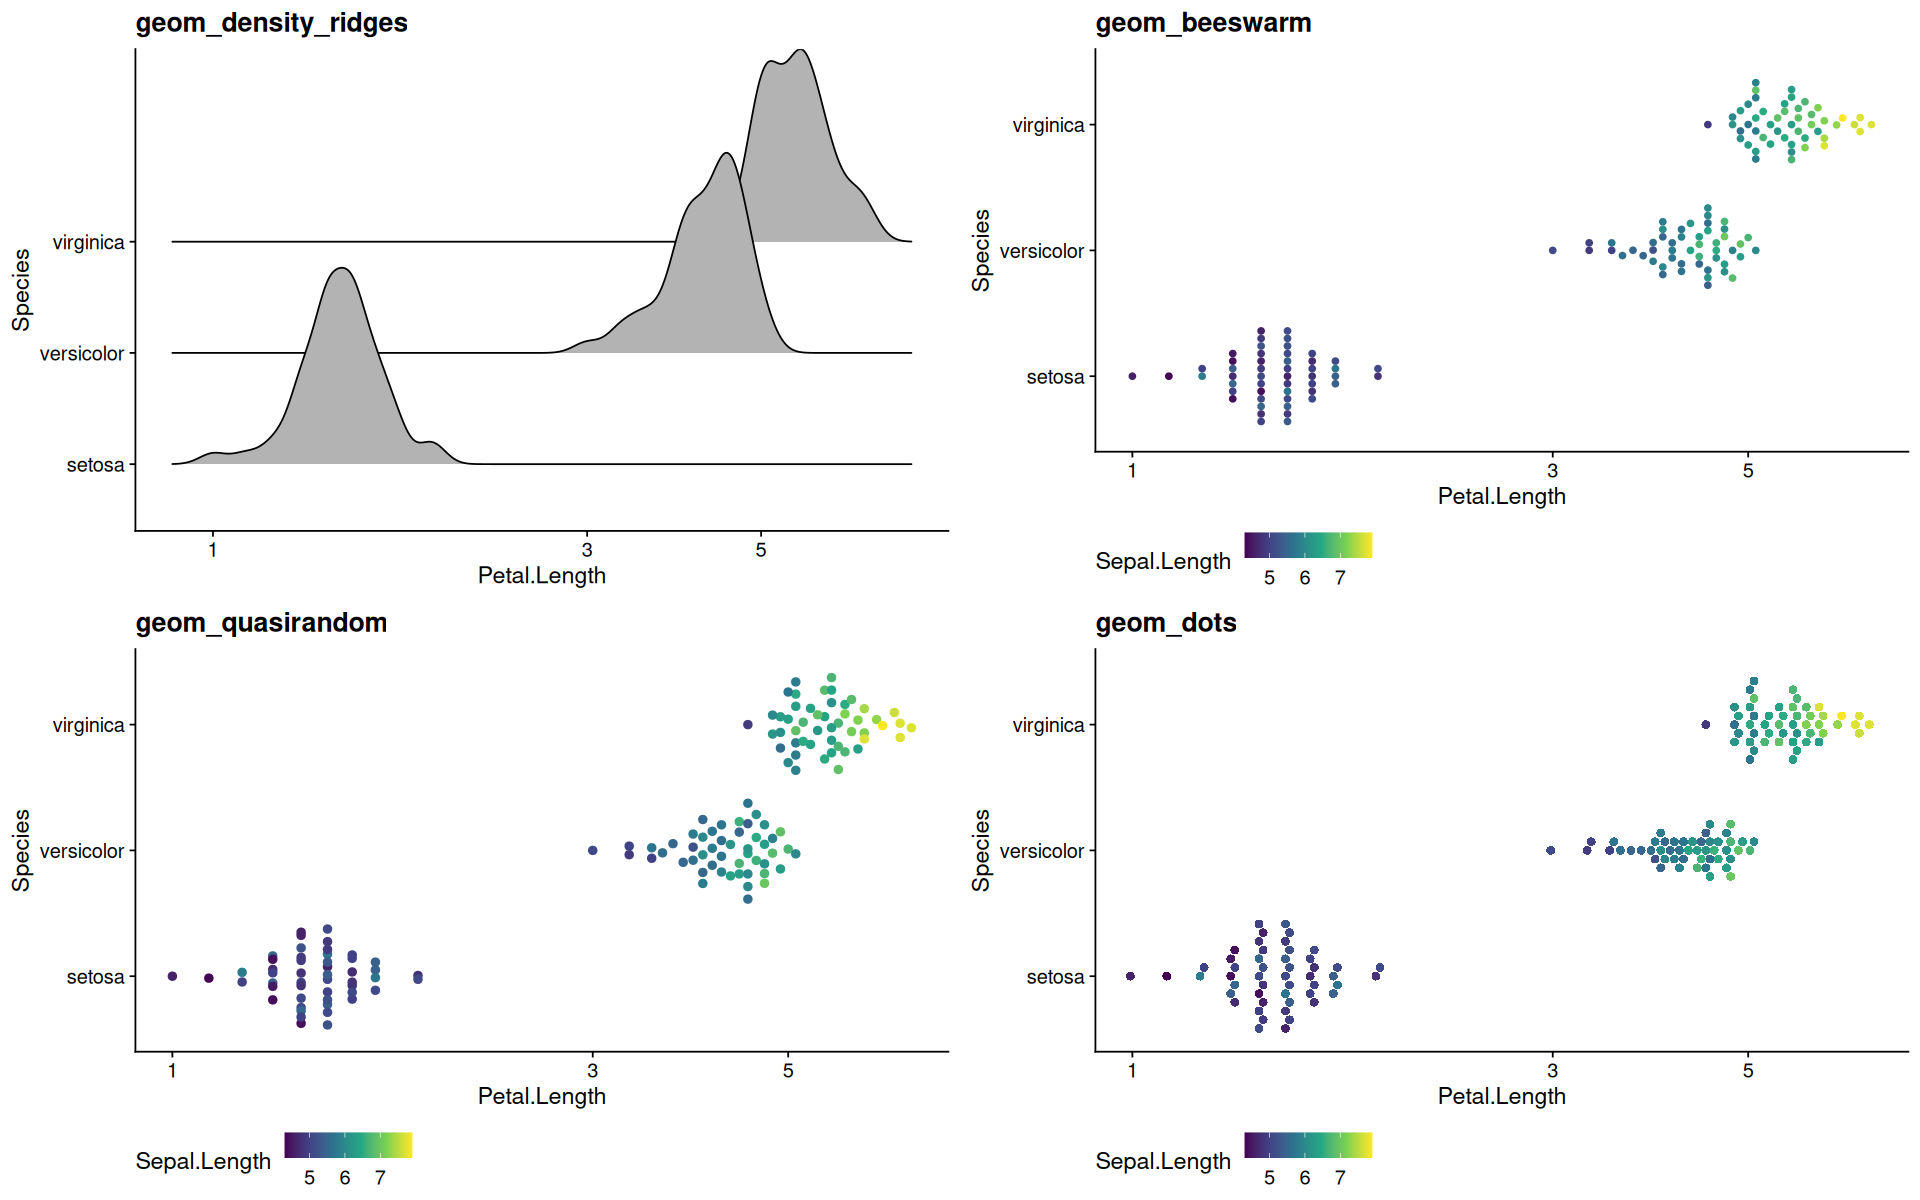
p1 <- p + geom_density_ridges() + ggtitle('geom_density_ridges')
p2 <- p + geom_beeswarm(aes(color=Sepal.Length),cex=2,method = "swarm") + scale_color_viridis_c() + ggtitle('geom_beeswarm')
p3 <- p + geom_quasirandom(aes(color=Sepal.Length),size=2) + scale_color_viridis_c() + ggtitle('geom_quasirandom')
p4 <- p + geom_dots(aes(fill=Sepal.Length),side='both', layout='hex', color=NA) + scale_fill_viridis_c() + ggtitle('geom_dots')
plot_grid(p1,p2,p3,p4)
Picking joint bandwidth of 0.0173

Orientation inferred to be along y-axis; override with `position_quasirandom(orientation = 'x')`