suppressPackageStartupMessages({
library(tidyverse)
library(cowplot)
library(ggrepel)
library(scales)
})
theme_set(theme_cowplot())
options(repr.plot.width=15, repr.plot.height=9)Dataset
The data is from the monthy Steam platform survey
The dataset used here was compiled by: jdegene
df <- read_csv('shs.csv', col_types='')
head(df,3)df_plat = read_csv('shs_platform.csv', col_types='')
head(df_plat,3)CPU
Processor vendor
filter(df_plat, grepl('Proc', category)) |>
filter(platform %in% c('pc','linux')) |>
filter(grepl('GenuineIntel|AuthenticAMD', name)) |>
mutate(
    label=ifelse(date==max(date, na.rm=T), sprintf("%s | %.4g%%",name,percentage*100), NA)
) |>
ggplot(aes(x=date, y=percentage, color=name)) +
geom_hline(yintercept=0.5, color='gray') +
geom_line(alpha=0.3) +
geom_smooth(se=F, span=0.5, linewidth=1) +
scale_y_continuous(labels=percent_format()) +
geom_label_repel(aes(label=label), hjust='left', direction = 'y', nudge_x=2.5e3, segment.color='gray') +
guides(color='none') +
scale_x_date(date_breaks='2 years', date_labels = '%Y') +
labs(title='Processor vendor') +
facet_wrap(~platform, ncol=2)
`geom_smooth()` using method = 'loess' and formula = 'y ~ x'
Warning message:
"Removed 566 rows containing missing values or values outside the scale range (`geom_label_repel()`)."
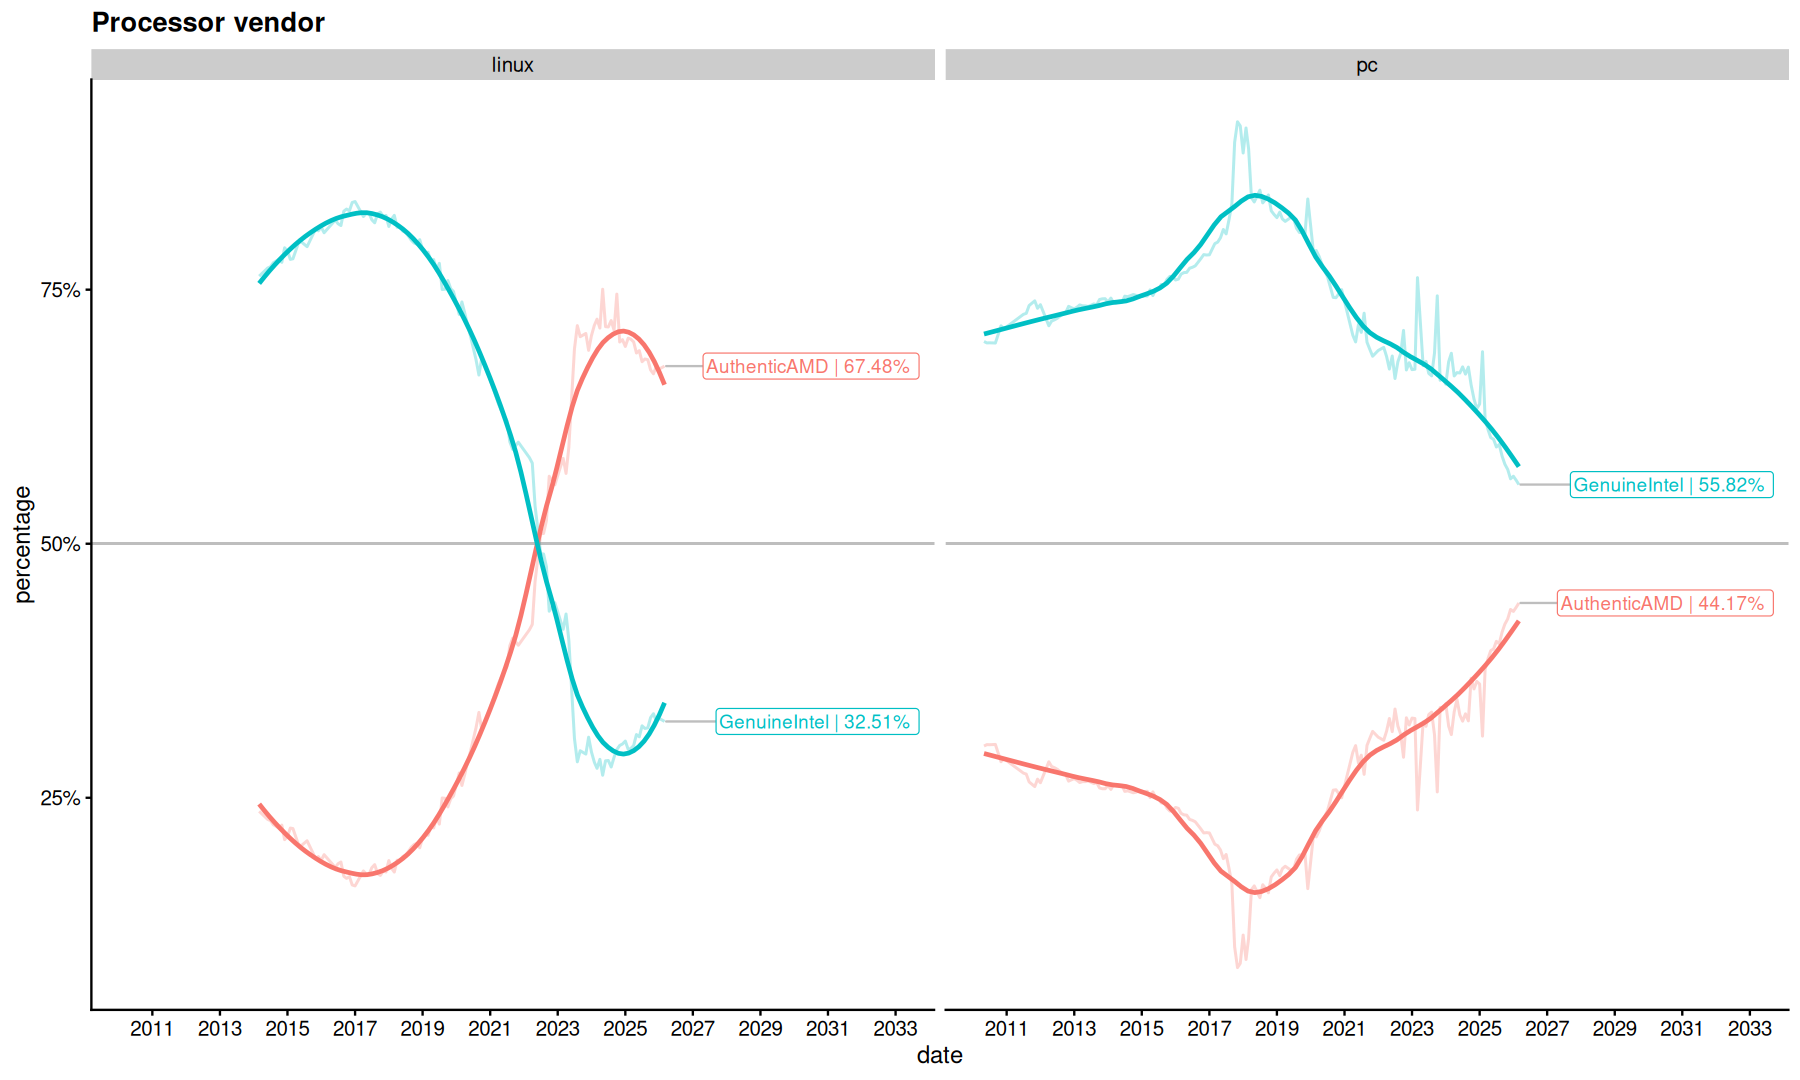
The data is separated by platform, “pc” here is Windows systems.
filter(df_plat, grepl('Proc', category)) |>
filter(platform=='pc', date>ymd('2018-03-01')) |>
filter(grepl('GenuineIntel|AuthenticAMD', name)) |>
ggplot(aes(x=date, y=percentage, color=name)) +
geom_rect(aes(ymin=0, ymax=1, xmin=ymd('2026-03-01'), xmax=ymd('2030-01-01')), fill='#FAFAD2',alpha=1, color=NA) +
annotate(geom='text', x=ymd('2027-01-01'), y=0.25, label='Prediction') +
geom_line(alpha=0.5) +
geom_smooth(method='lm', fullrange=TRUE, linewidth=1) +
labs(title='Processor vendor', color='') +
scale_y_continuous(labels=percent_format()) +
scale_x_date(limits=c(ymd('2018-03-01'), ymd('2030-01-01')), date_breaks = '1 years', date_labels = '%Y')
`geom_smooth()` using formula = 'y ~ x'
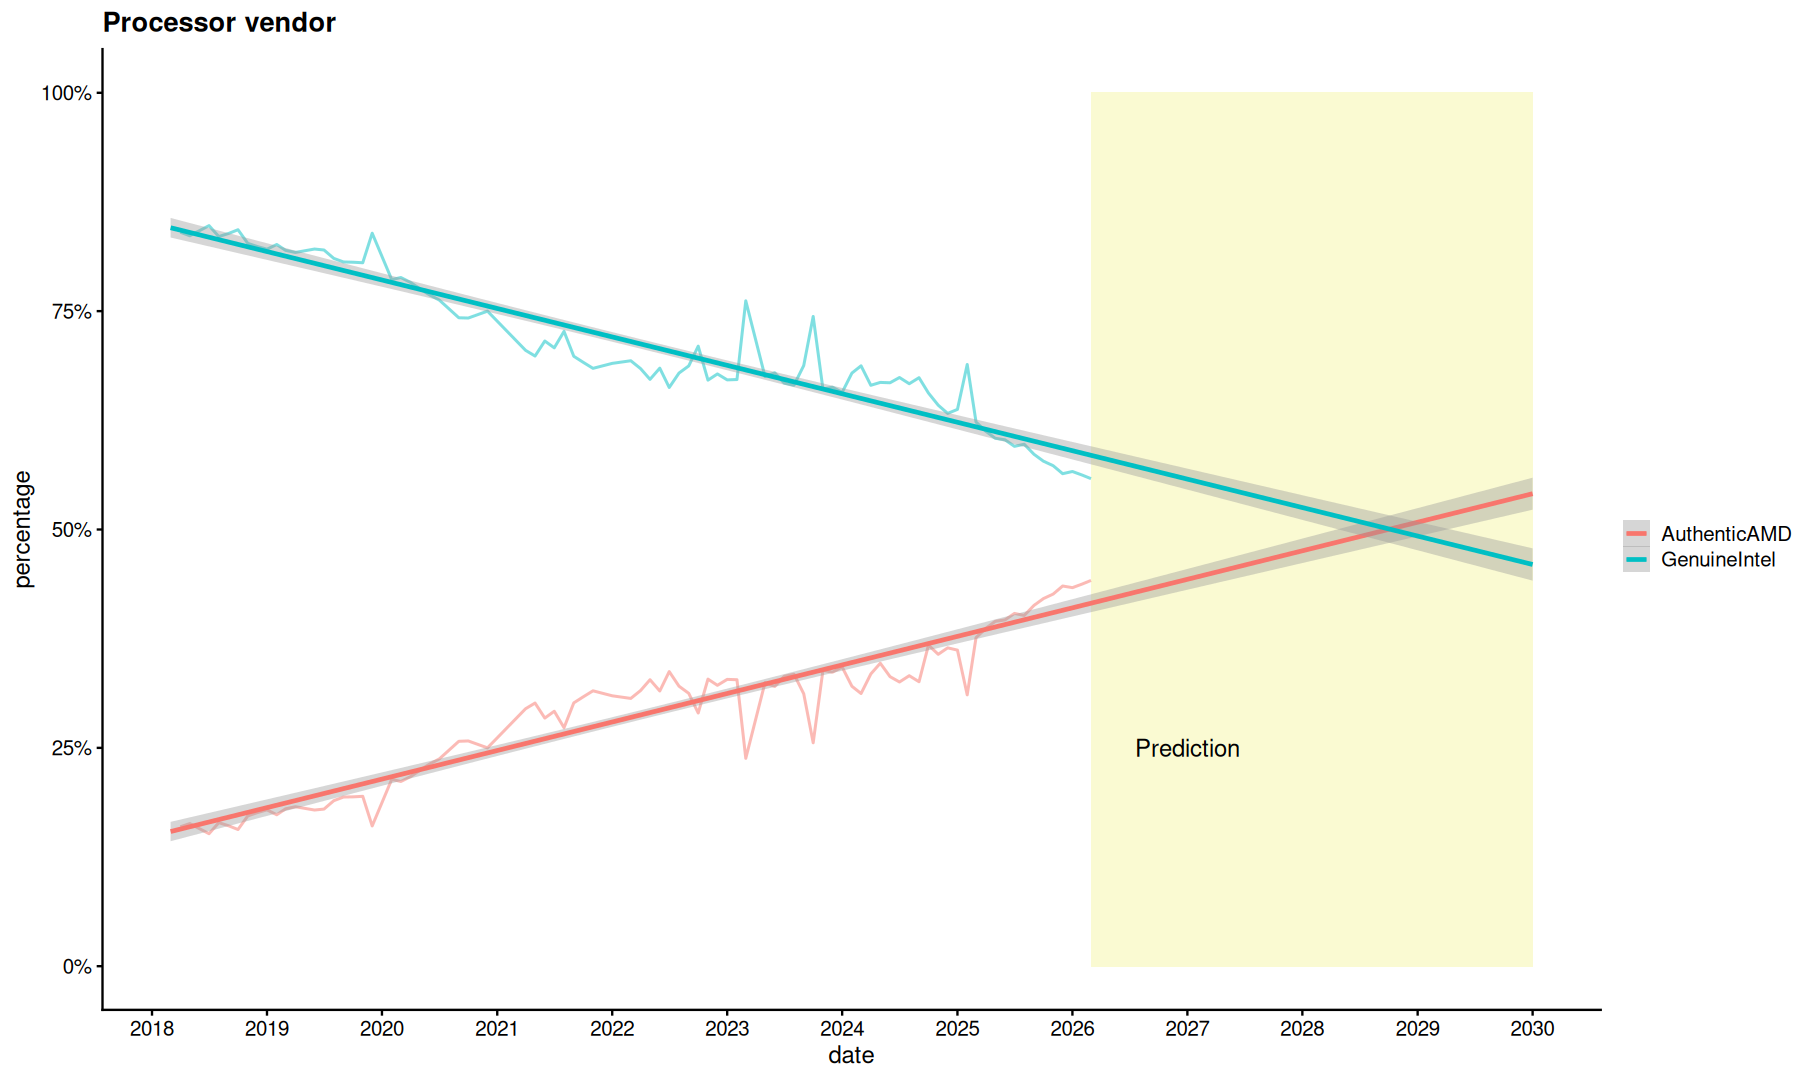
The regression line suggests AMD will overtake by 2029 if the trend continues.
Since Nov-2025, the mac platform does not sum to 100%, it probably is not counting Apple M-series processors properly:
filter(df_plat, grepl('Proc', category), platform=='mac') |>
ggplot(aes(x=date, y=percentage, color=name)) +
geom_line() +
labs(title='Processor vendor on mac platform')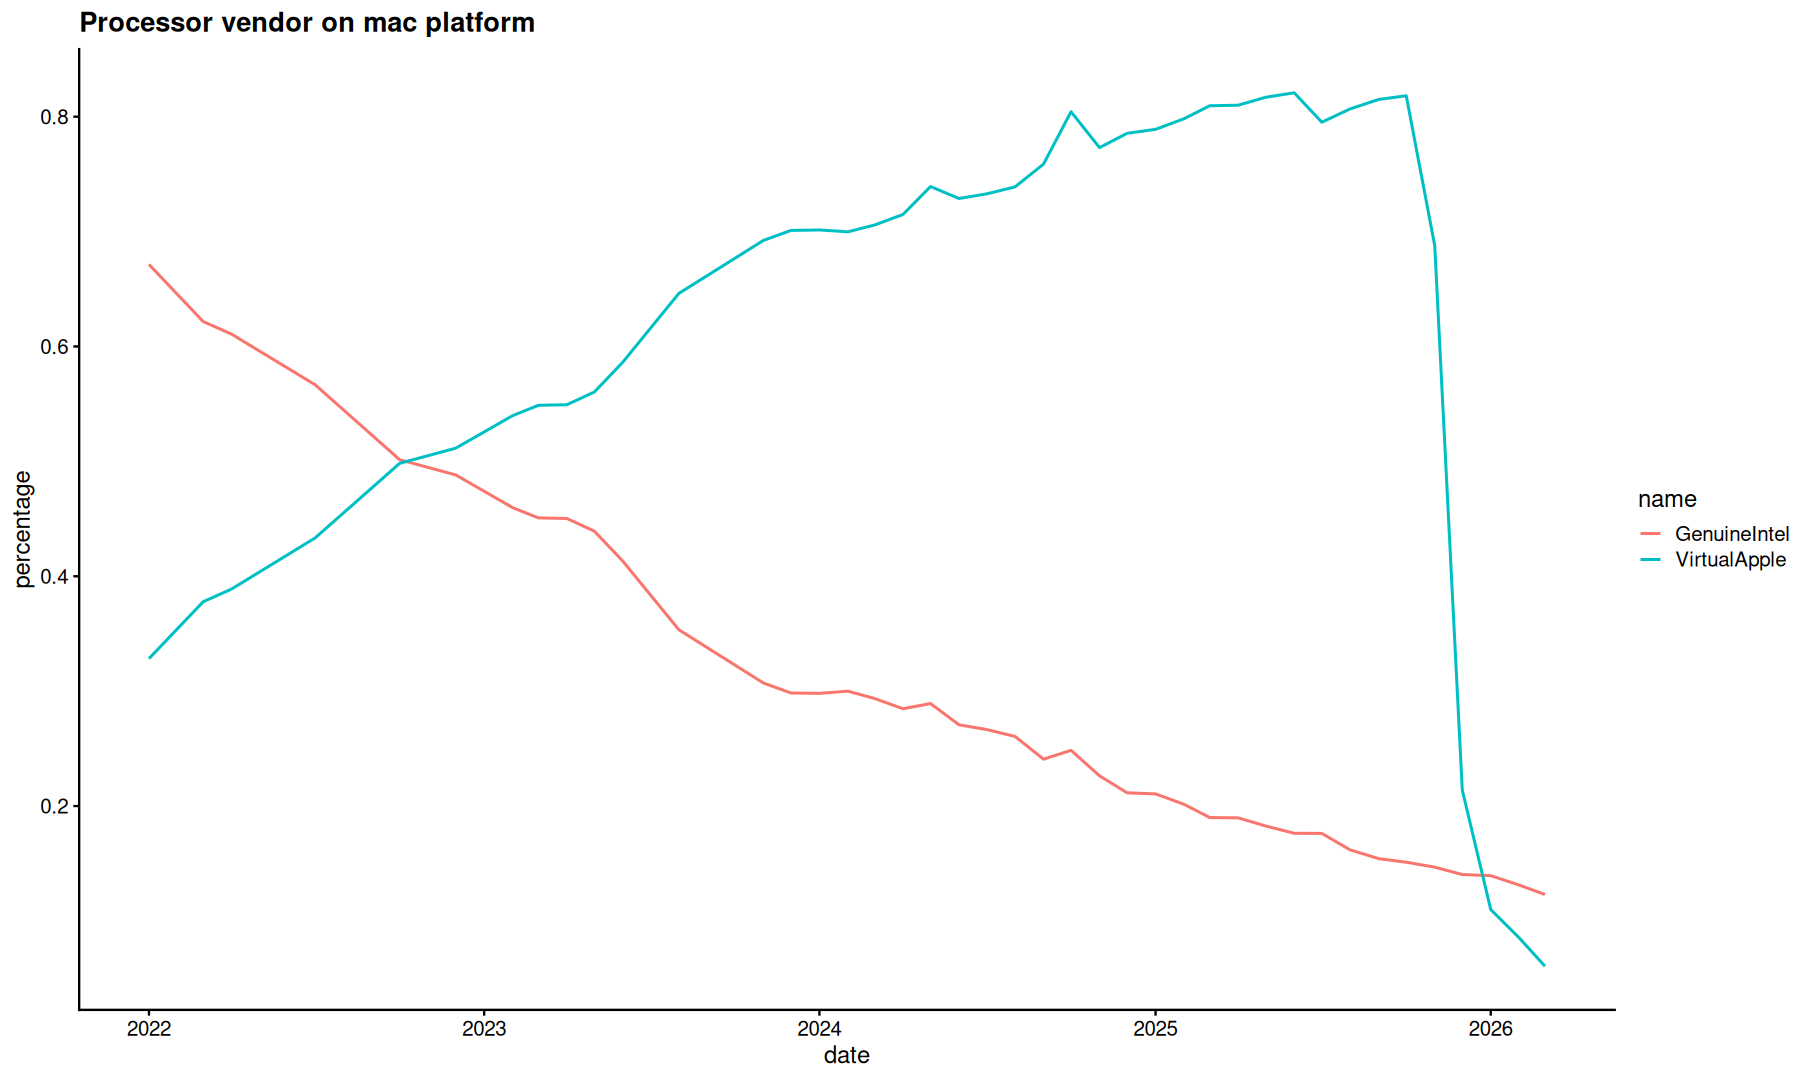
filter(df_plat, grepl('Proc', category)) |>
slice_max(date, n=1) |>
arrange(platform, -percentage)Number of cpus
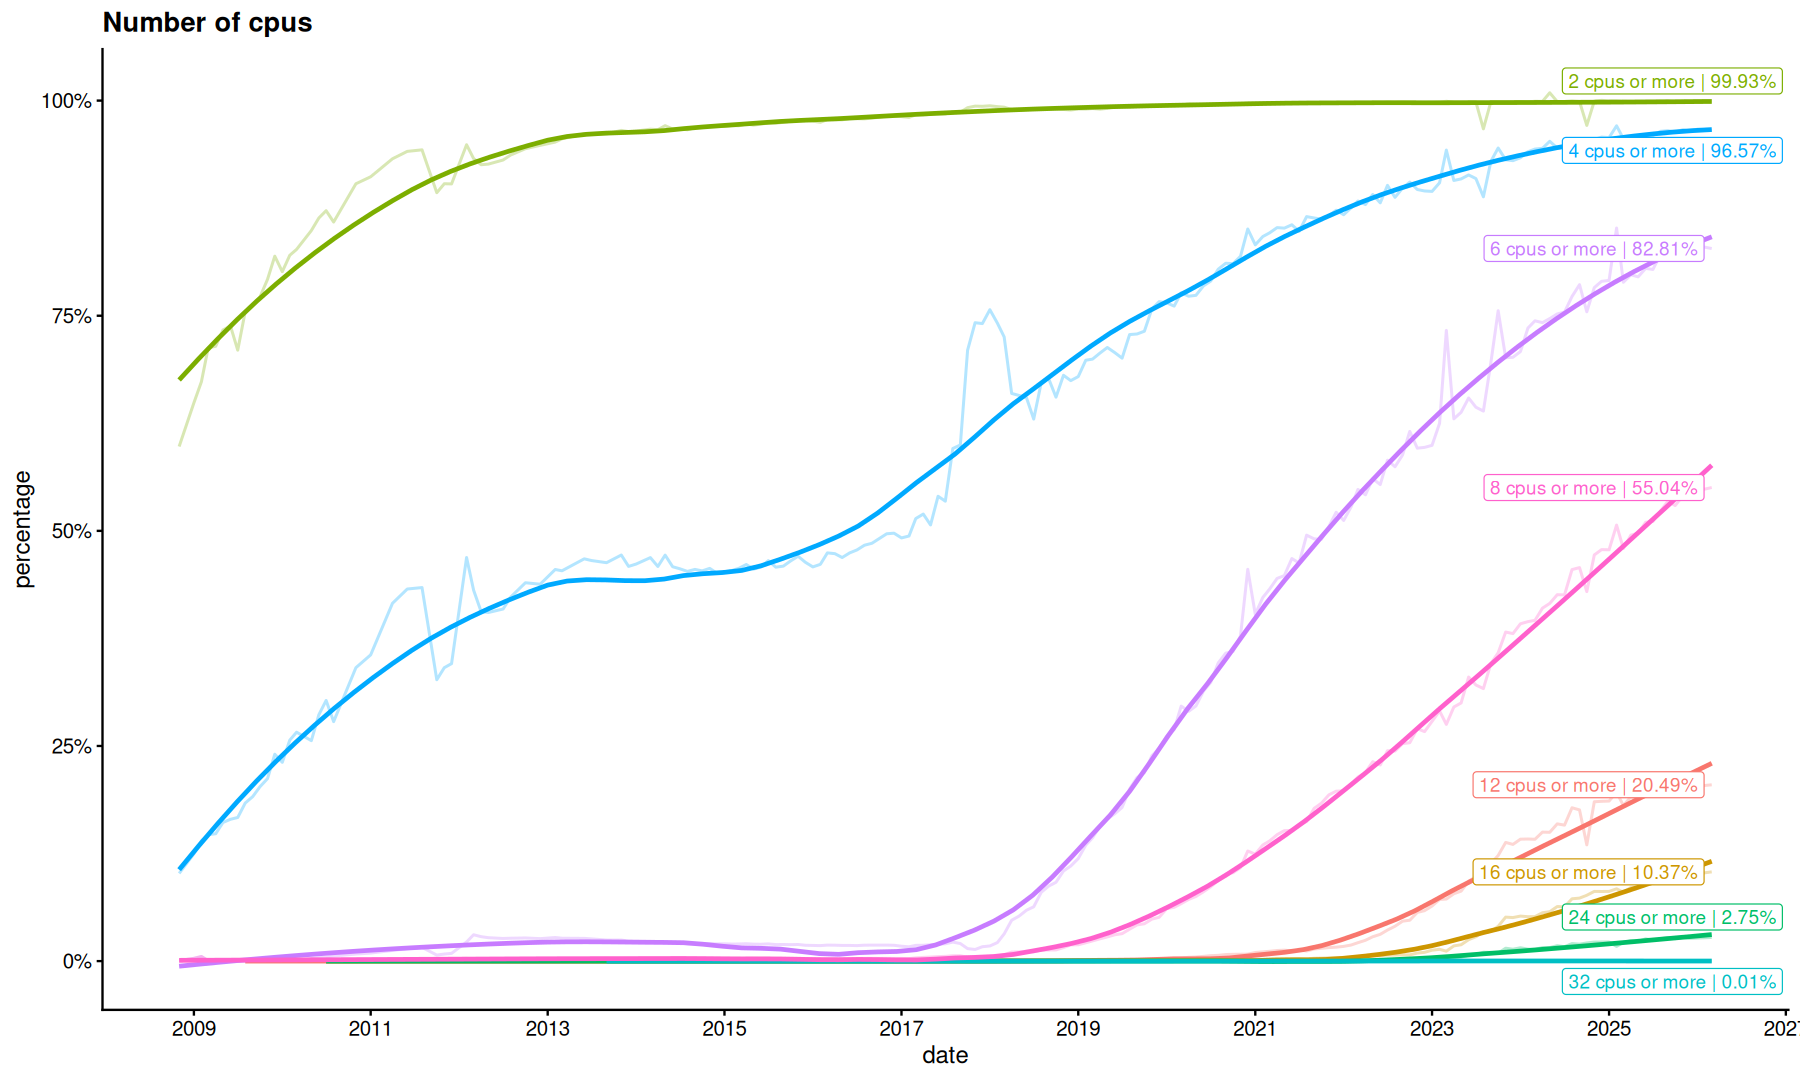
map_df(c(2, 4, 6, 8, 12, 16, 24, 32), function(target_p) {
    filter(df, grepl('Physical CPUs', category)) |>
    mutate(n_cpus = as.numeric(str_extract(name, '(\\d+)', group=1))) |>
    filter(!is.na(n_cpus), n_cpus >= target_p) |>
    distinct(date, percentage) |>
    mutate(label=paste(target_p, 'cpus or more'))
}) |>
summarize(
    percentage=sum(percentage),
    .by = c(date, label)
) |>
mutate(
    label2=ifelse(date==max(date, na.rm=T), sprintf("%s | %.4g%%",label,percentage*100), NA)
) |>
ggplot(aes(x=date, y=percentage, color=label)) +
geom_line(alpha=0.3) +
geom_smooth(se=F, span=0.5, linewidth=1) +
scale_y_continuous(labels=percent_format()) +
scale_x_date(date_breaks='2 years', date_labels = '%Y') +
geom_label_repel(aes(label=label2)) +
labs(title='Number of cpus') +
guides(color='none')
`geom_smooth()` using method = 'loess' and formula = 'y ~ x'
Warning message:
"Removed 1369 rows containing missing values or values outside the scale range (`geom_label_repel()`)."
Intel CPU Speeds
map_df(c(1.4, 2.0, 2.3, 2.7, 3, 3.3, 3.7), function(target_f) {
    filter(df, category == 'Intel CPU Speeds') |>
    mutate(
        f0 = case_when(
            grepl('^\\S+ Ghz to', name) ~ str_extract(name, '^(\\S+) Ghz to', group=1),
            grepl('\\S+ Ghz and above', name) ~ str_extract(name, '(\\S+) Ghz', group=1),
            TRUE ~ NA
        )
    ) |>
    filter(f0 >= target_f) |>
    distinct(date, percentage) |>
    mutate(freq=target_f)
}) |>
summarize(
    percentage=sum(percentage),
    .by =c(date, freq)
) |>
mutate(label=ifelse(date==max(date, na.rm=T), sprintf('%.1f Ghz or more | %.2g%%', freq, percentage*100), NA)) |>
ggplot(aes(x=date, y=percentage, color=freq, group=freq)) +
geom_line(alpha=0.3) +
geom_smooth(se=F, span=0.5, linewidth=1) +
geom_label_repel(aes(label=label)) +
scale_y_continuous(labels=percent_format()) +
labs(title='Intel CPU Speeds') +
scale_color_viridis_c(option='turbo') +
scale_x_date(date_breaks='2 years', date_labels ='%Y')
`geom_smooth()` using method = 'loess' and formula = 'y ~ x'
Warning message:
"Removed 1317 rows containing missing values or values outside the scale range (`geom_label_repel()`)."
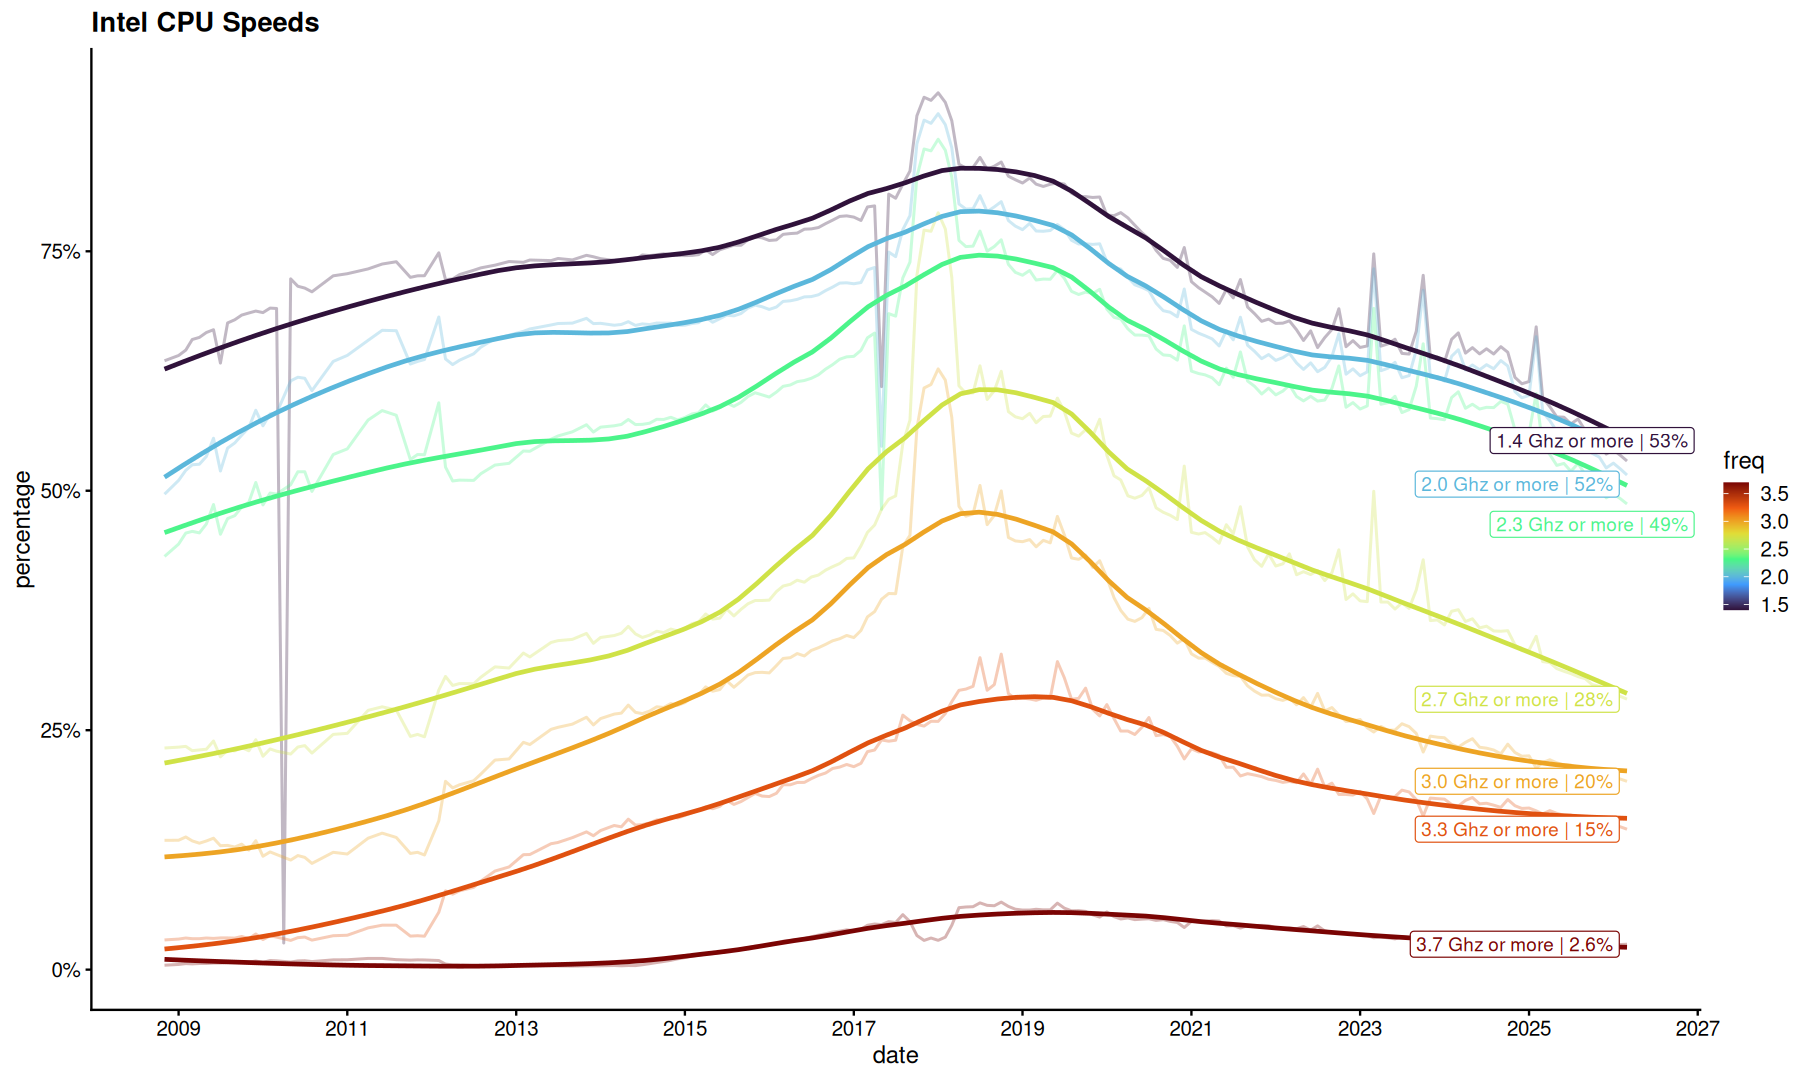
It is unclear how this data is collected, but it is probabaly base cpu frequency.
You can see that cpu frequency starts decreasing in 2019, around the same time that cpu core amount increases.
System RAM
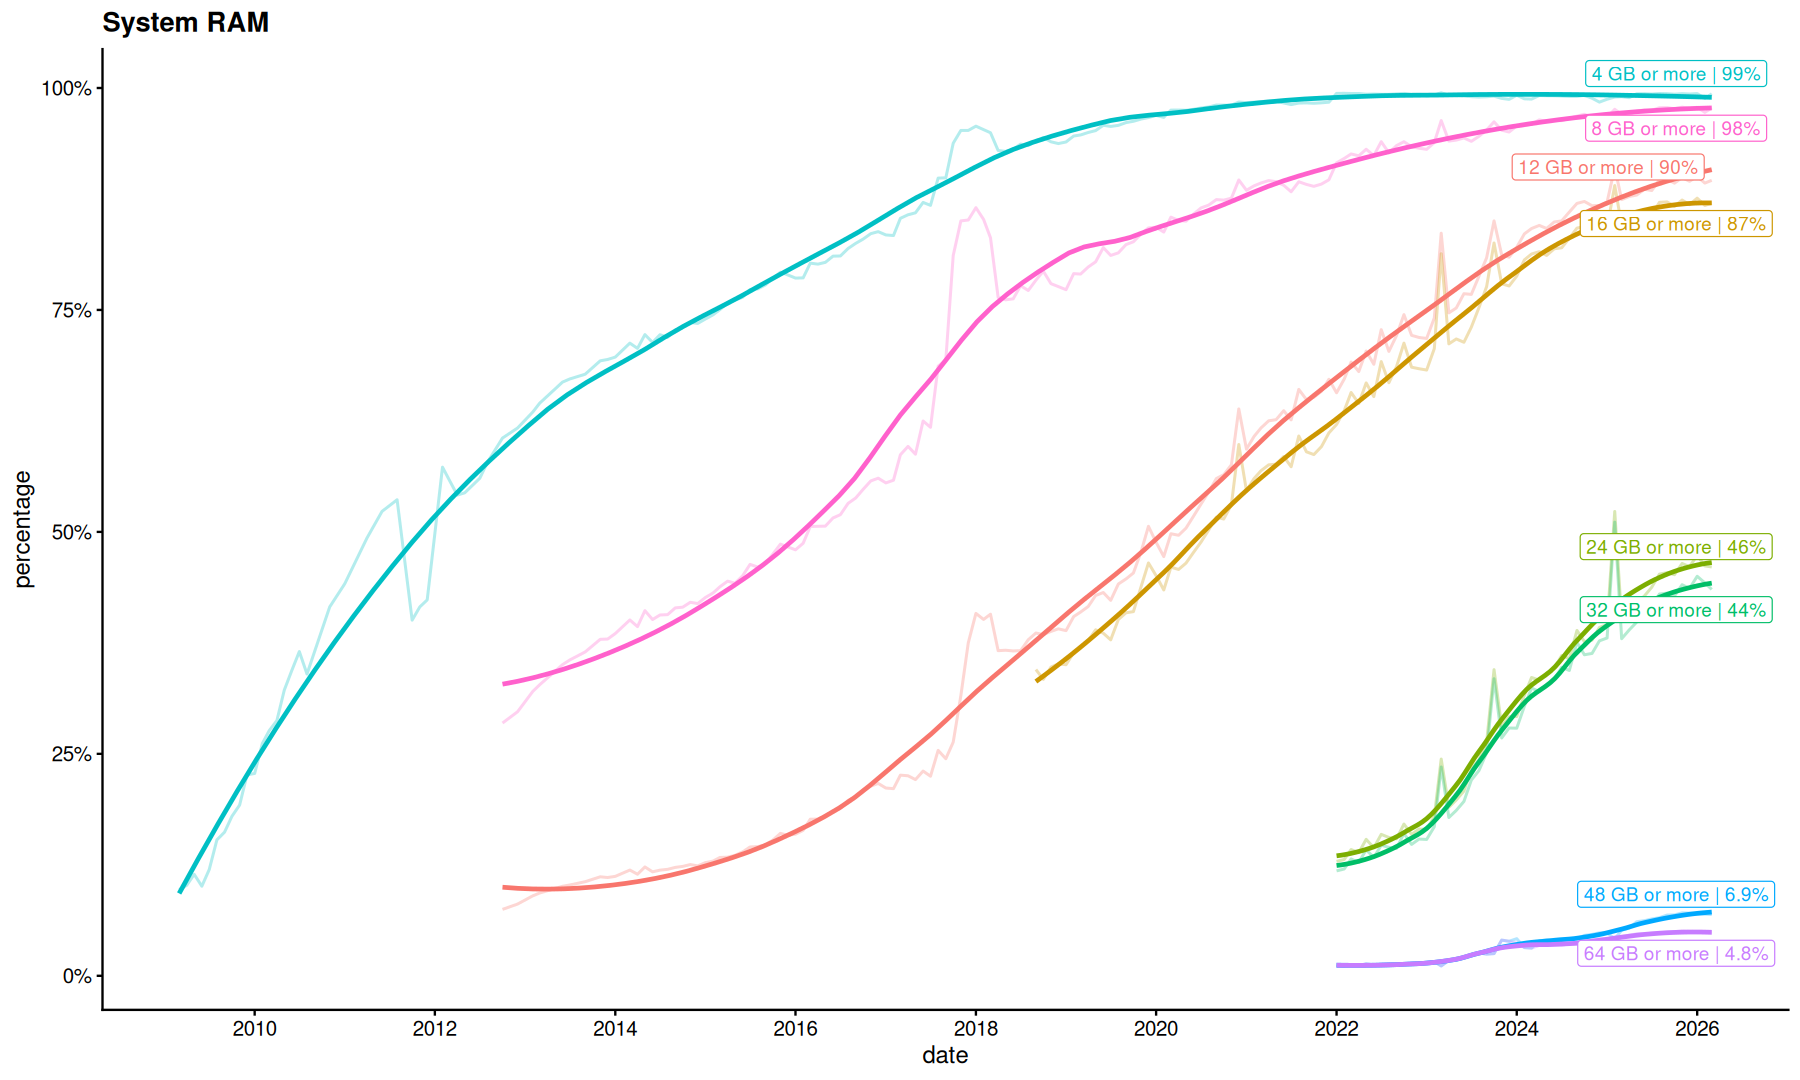
map_df(c(4, 8, 12, 16, 24, 32, 48, 64), function(target_p) {
    filter(df, category=='System RAM') |>
    mutate(
        val=as.numeric(str_extract(name, '(\\S+) [MG]B', group=1)),
        unit=str_extract(name, '([MG]B)', group=1),
    ) |>
    filter(val >= target_p, unit == 'GB') |>
    summarize(
        percentage=sum(percentage),
        .by=date
    ) |>
    mutate(label=paste(target_p,'GB or more'))
}) |>
mutate(label2=ifelse(date==max(date, na.rm=T), sprintf('%s | %2.2g%%',label,100*percentage), NA), .by=label) |>
ggplot(aes(x=date, y=percentage, color=label)) +
geom_line(alpha=0.3) +
geom_smooth(se=F,span=0.5, linewidth=1) +
geom_label_repel(aes(label=label2)) +
guides(color='none') +
labs(title='System RAM') +
scale_x_date(date_breaks = '2 years', date_labels = '%Y') +
scale_y_continuous(label=percent_format())
`geom_smooth()` using method = 'loess' and formula = 'y ~ x'
Warning message:
"Removed 784 rows containing missing values or values outside the scale range (`geom_label_repel()`)."
Graphics Card
VRAM
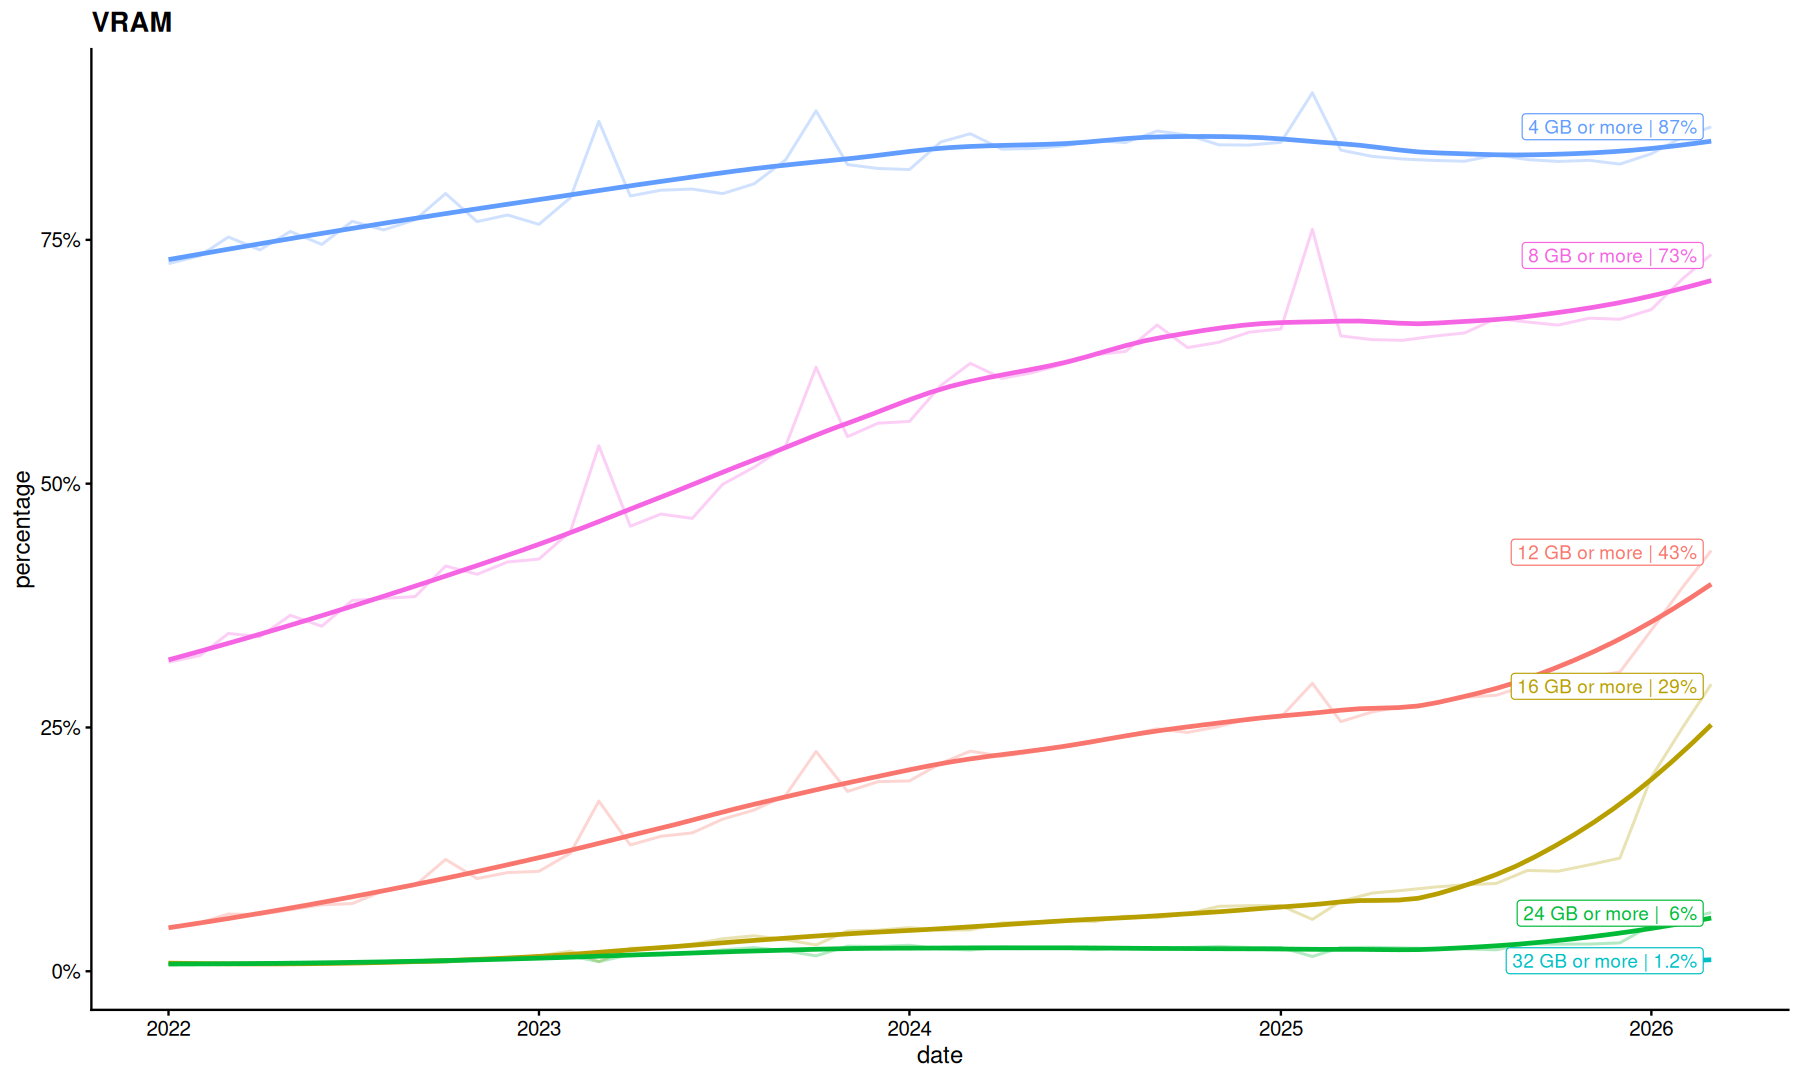
map_df(c(4, 8, 12, 16, 24, 32), function(target_p) {
    filter(df, category=='VRAM') |>
    mutate(
        val=as.numeric(str_extract(name, '(\\S+) [MG]B', group=1)),
        unit=str_extract(name, '([MG]B)', group=1),
    ) |>
    filter(val >= target_p, unit == 'GB') |>
    summarize(
        percentage=sum(percentage),
        .by=date
    ) |>
    mutate(label=paste(target_p,'GB or more'))
}) |>
mutate(label2=ifelse(date==max(date, na.rm=T), sprintf('%s | %2.2g%%',label,100*percentage), NA), .by=label) |>
ggplot(aes(x=date, y=percentage, color=label)) +
geom_line(alpha=0.3) +
geom_smooth(se=F,span=0.5, linewidth=1) +
geom_label_repel(aes(label=label2)) +
guides(color='none') +
labs(title='VRAM') +
scale_x_date(date_breaks = '1 years', date_labels = '%Y') +
scale_y_continuous(label=percent_format()) -> p
suppressWarnings(print(p))
`geom_smooth()` using method = 'loess' and formula = 'y ~ x'
Video Card Vendor
filter(df, grepl('Video Card Desc', category)) |>
mutate(
    vendor=case_when(
        grepl('AMD|Radeon|ATI', name) ~ 'AMD',
        grepl('Intel|Haswell', name) ~ 'Intel',
        grepl('NVIDIA', name) ~ 'NVIDIA',
        TRUE ~ 'Other'
    ),
    vendor = factor(vendor, levels=c('AMD','NVIDIA','Intel','Other'))
) |>
summarize(
    percentage=sum(percentage),
    .by = c(date, vendor)
) |>
mutate(label=ifelse(date==max(date, na.rm=T), sprintf('%s | %.2g%%', vendor, percentage*100), NA)) |>
ggplot(aes(x=date, y=percentage, color=vendor)) +
geom_line(alpha=0.3) +
geom_smooth(se=F, span=1, linewidth=1) +
guides(color='none') +
labs(title='Video Card Vendor') +
scale_y_continuous(label=percent_format()) +
geom_label_repel(aes(label=label), max.overlaps = Inf)
`geom_smooth()` using method = 'loess' and formula = 'y ~ x'
Warning message:
"Removed 692 rows containing missing values or values outside the scale range (`geom_label_repel()`)."
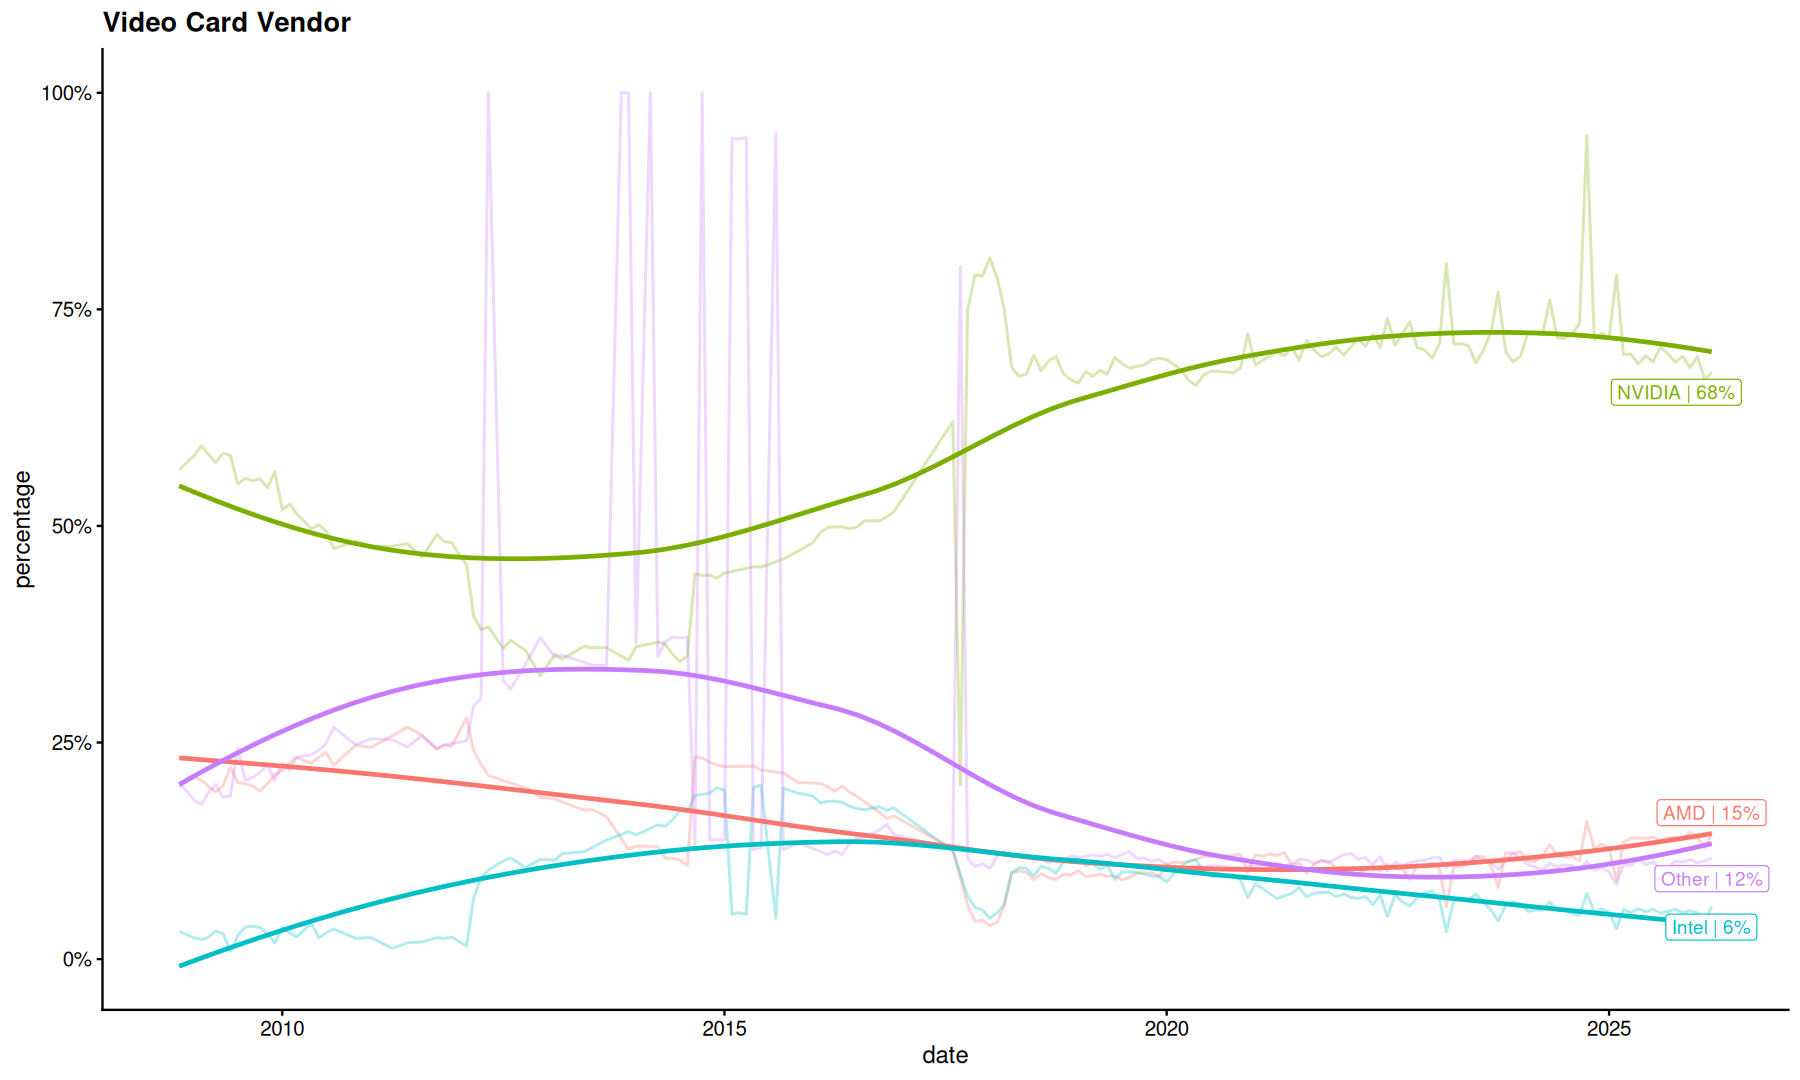
Video Card Models
filter(df, grepl('Video Card Desc', category)) |>
filter(date==max(date)) |>
mutate(
    name = ifelse(is.na(name), 'Other', name),
    vendor=case_when(
        grepl('AMD|Radeon|ATI', name) ~ 'AMD',
        grepl('Intel|Haswell', name) ~ 'Intel',
        grepl('NVIDIA', name) ~ 'NVIDIA',
        TRUE ~ 'Other'
    ),
    vendor = factor(vendor, levels=c('AMD','NVIDIA','Intel','Other'))
) |>
summarize(
    percentage=sum(percentage),
    .by = c(vendor, name)
) |>
filter(vendor != 'Other') |>
top_n(percentage, n=50) |>
ggplot(aes(y=fct_reorder(name, percentage), x=percentage, fill=vendor)) +
geom_col() +
theme(legend.position = 'inside', legend.position.inside = c(0.3, 0.1)) +
coord_cartesian(expand=0) +
labs(title='Video Card Models',y=NULL) +
scale_x_continuous(labels=percent_format())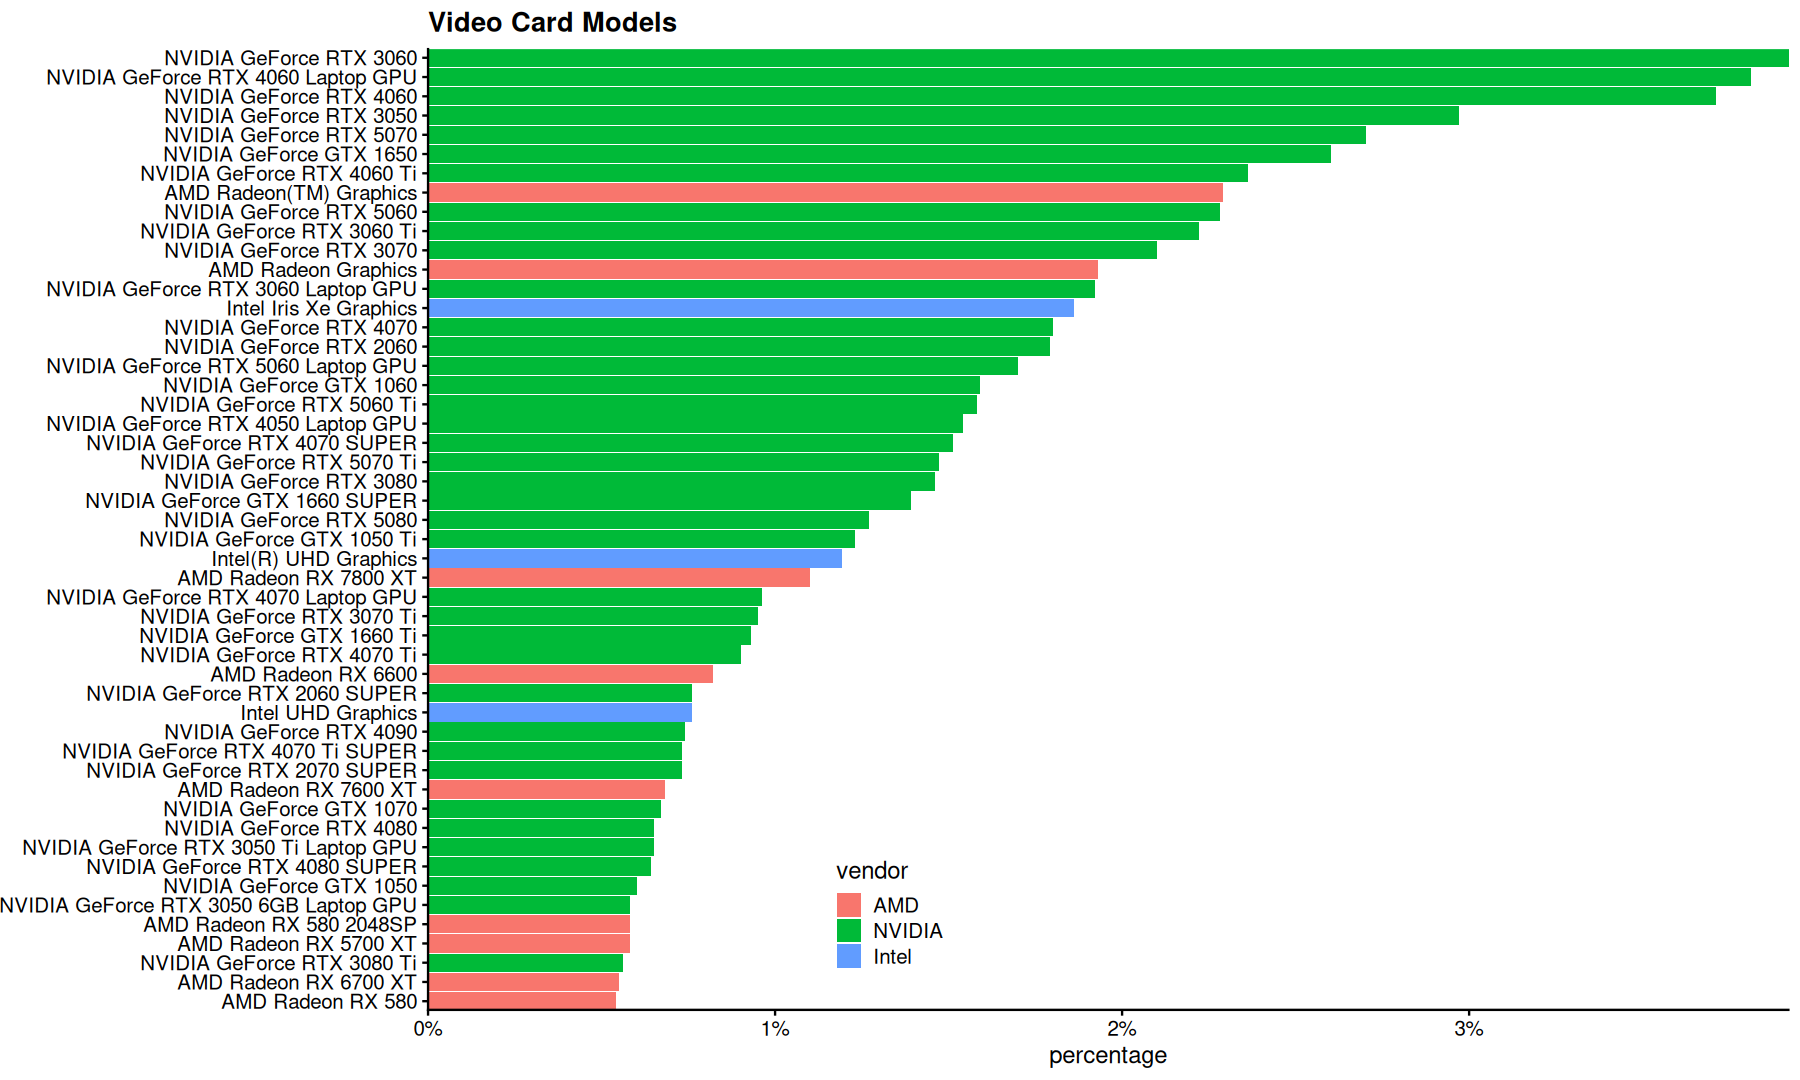
filter(df, grepl('Video Card Desc', category)) |>
filter(grepl('Mobile|Laptop', name)) |>
summarize(
    percentage=sum(percentage),
    .by = c(date)
) |>
mutate(label=ifelse(date==max(date), sprintf('%.2g%%', percentage*100), NA)) |>
ggplot(aes(x=date, y=percentage)) +
geom_line(alpha=0.3) +
geom_smooth(se=F, span=0.5, linewidth=1, color='black') +
geom_label_repel(aes(label=label)) +
labs(title='Mobile/Laptop GPUs') +
scale_y_continuous(label=percent_format())
`geom_smooth()` using method = 'loess' and formula = 'y ~ x'
Warning message:
"Removed 138 rows containing missing values or values outside the scale range (`geom_label_repel()`)."
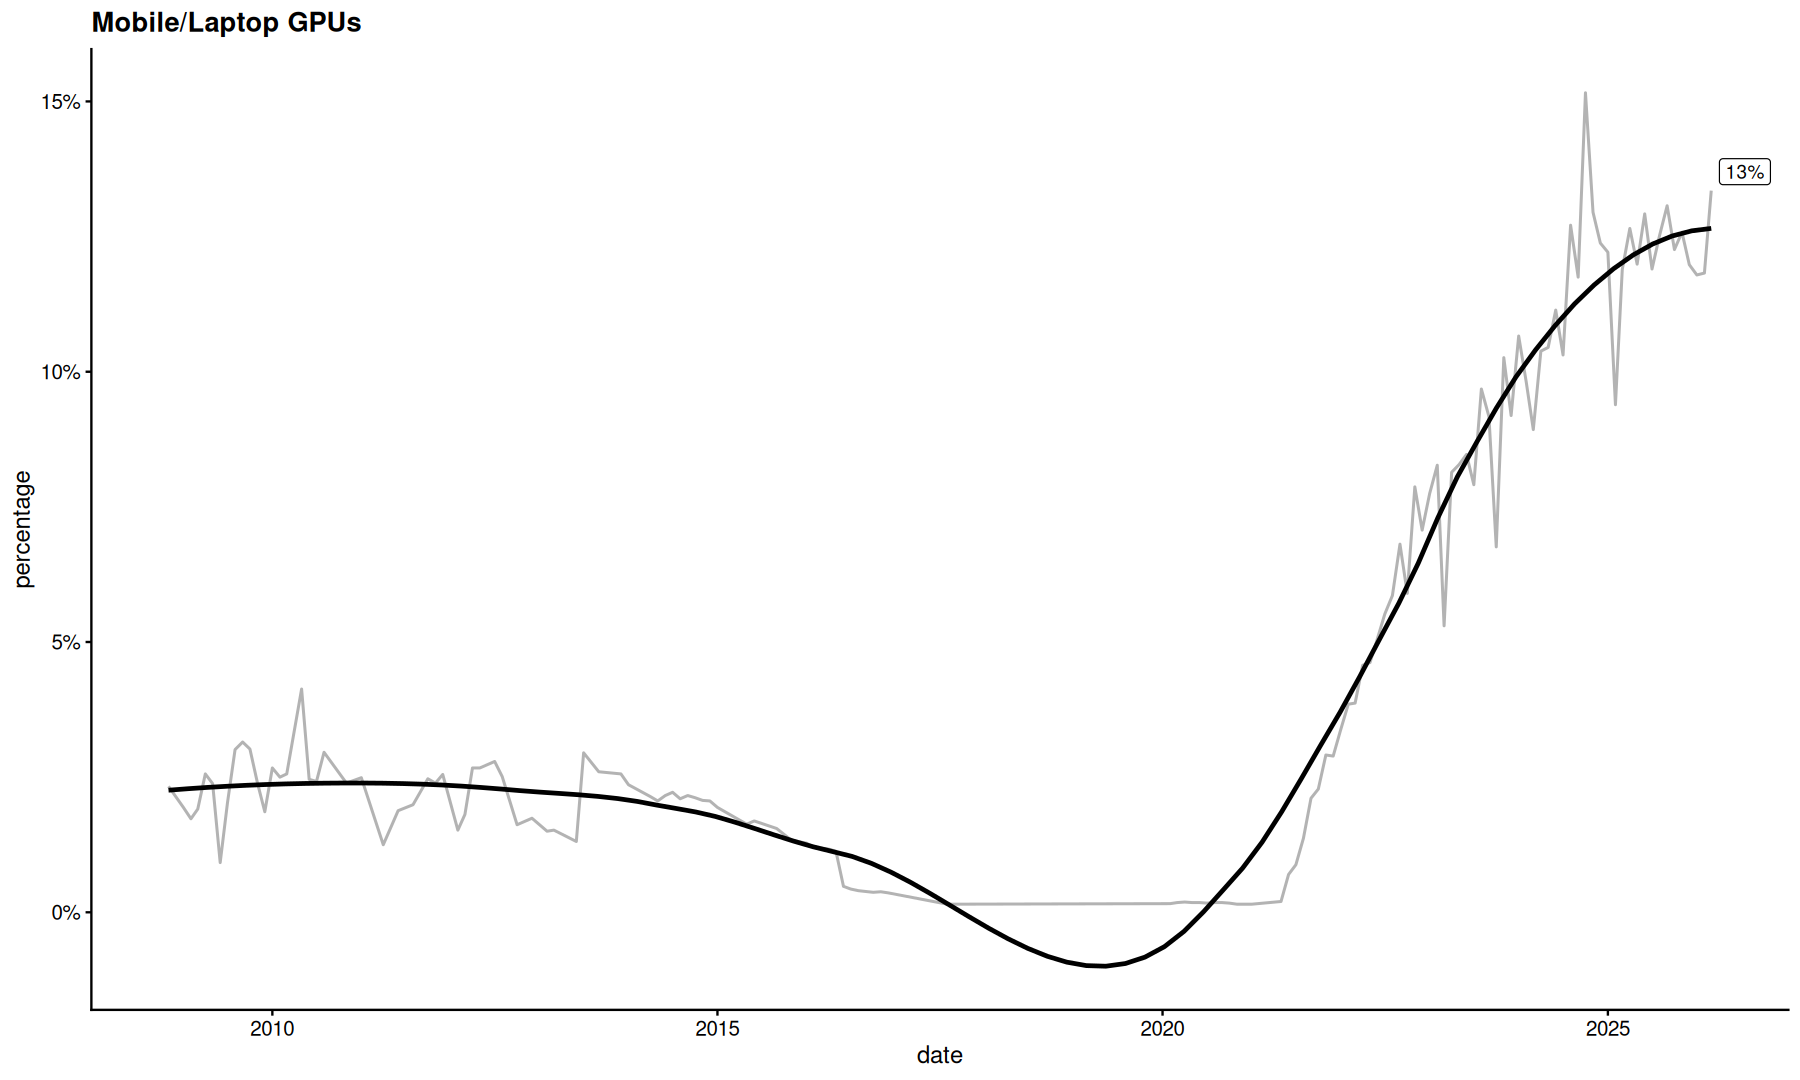
This is an approximation, because some models don’t have a distinct name for the mobile version.
Operating System
Note that the survey page does not list “Other” distros, so its necessary to merge data from the platform table to properly account for this, I’m using the same code as in create_readme.py
linux_v_list <- filter(df_plat, category=='Linux Version', name != 'Other') |> with(unique(name))
os_df <-
    filter(df, category=='OS Version') |>
    mutate(
        OS = case_when(
            grepl('Windows', name) ~ 'Windows',
            grepl('MacOS', name) ~ 'MacOS',
            name %in% linux_v_list ~ 'Linux',
            TRUE ~ 'Other'
    ))
filter(df_plat, grepl("Version", category)) |>
rename(percentage_plat=percentage) |>
right_join(os_df, by=c('date','name')) |>
mutate(change.x=NULL,change.y=NULL) |>
mutate(
corr_fac = 1/sum(percentage_plat),
.by=c('OS','date')
) |>
mutate(
corr_fac=replace_na(corr_fac, 1),
p2 = percentage * corr_fac
) |>
summarize(
percentage=sum(p2),
.by=c(date, OS)
) |>
filter(date>ymd('2015-01-01')) |>
ggplot(aes(x=date, y=percentage, color=OS)) +
geom_line(alpha=0.5) +
geom_smooth(se=F, span=0.5, linewidth=1) +
facet_grid(OS~., scales='free_y') +
scale_x_date(date_breaks = '1 years', date_labels = '%Y') +
scale_y_continuous(labels=scales::percent_format()) +
labs(title='Operating System') +
guides(color='none')`geom_smooth()` using method = 'loess' and formula = 'y ~ x'
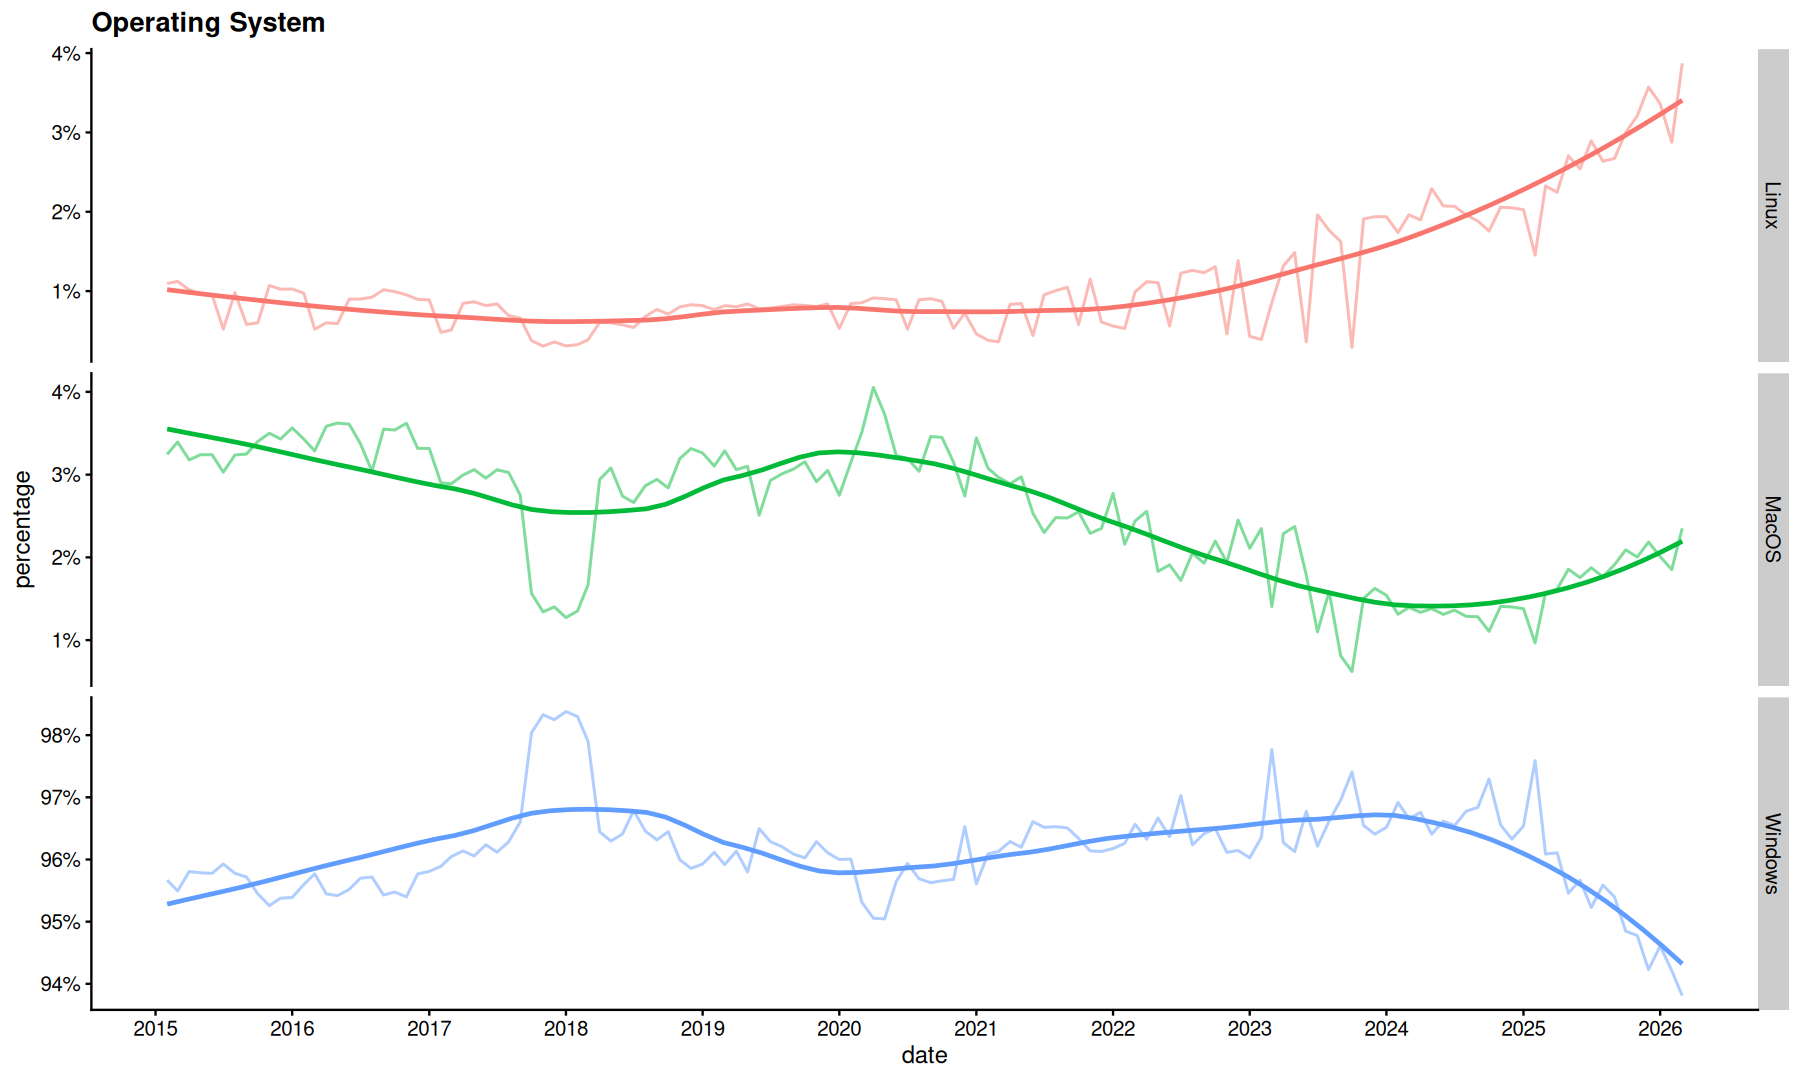
Linux distros
filter(df_plat, platform=='linux', category=='Linux Version') |>
mutate(
    distro=case_when(
        grepl('Ubuntu', name) ~ 'Ubuntu',
        grepl('Arch Linux', name) ~ 'Arch',
        grepl('SteamOS', name) ~ 'SteamOS',
        grepl('Pop!_OS', name) ~ 'Pop!_OS',
        grepl('Linux Mint', name) ~ 'Mint',
        grepl('Manjaro', name) ~ 'Manjaro',
        grepl('EndeavourOS', name) ~ 'EndeavourOS',
        grepl('CachyOS', name) ~ 'CachyOS',
        grepl('Bazzite', name) ~ 'Bazzite',
        grepl('Freedesktop', name) ~ 'Freedesktop SDK',
        grepl('Debian', name) ~ 'Debian',
        grepl('Nobara', name) ~ 'Nobara',
        grepl('Fedora', name) ~ 'Fedora',
        TRUE ~ 'Other'
    )
) -> df_distro
summarize(df_distro,
    percentage=sum(percentage),
    .by=c(date, distro)
) |>
mutate(label=ifelse(date==max(date, na.rm=T), sprintf("%s | %.4g%%",distro,percentage*100), NA), .by=distro) |>
ggplot(aes(x=date, y=percentage, color=distro)) +
geom_line(alpha=0.3) +
geom_smooth(se=F, span=0.5, linewidth=1) +
geom_label_repel(aes(label=label), max.overlaps = Inf) +
guides(color='none') +
scale_y_continuous(labels=percent_format()) +
labs(title='Linux distros') +
scale_x_date(date_breaks='1 years', date_labels = '%Y') -> p
suppressWarnings(print(p))
`geom_smooth()` using method = 'loess' and formula = 'y ~ x'
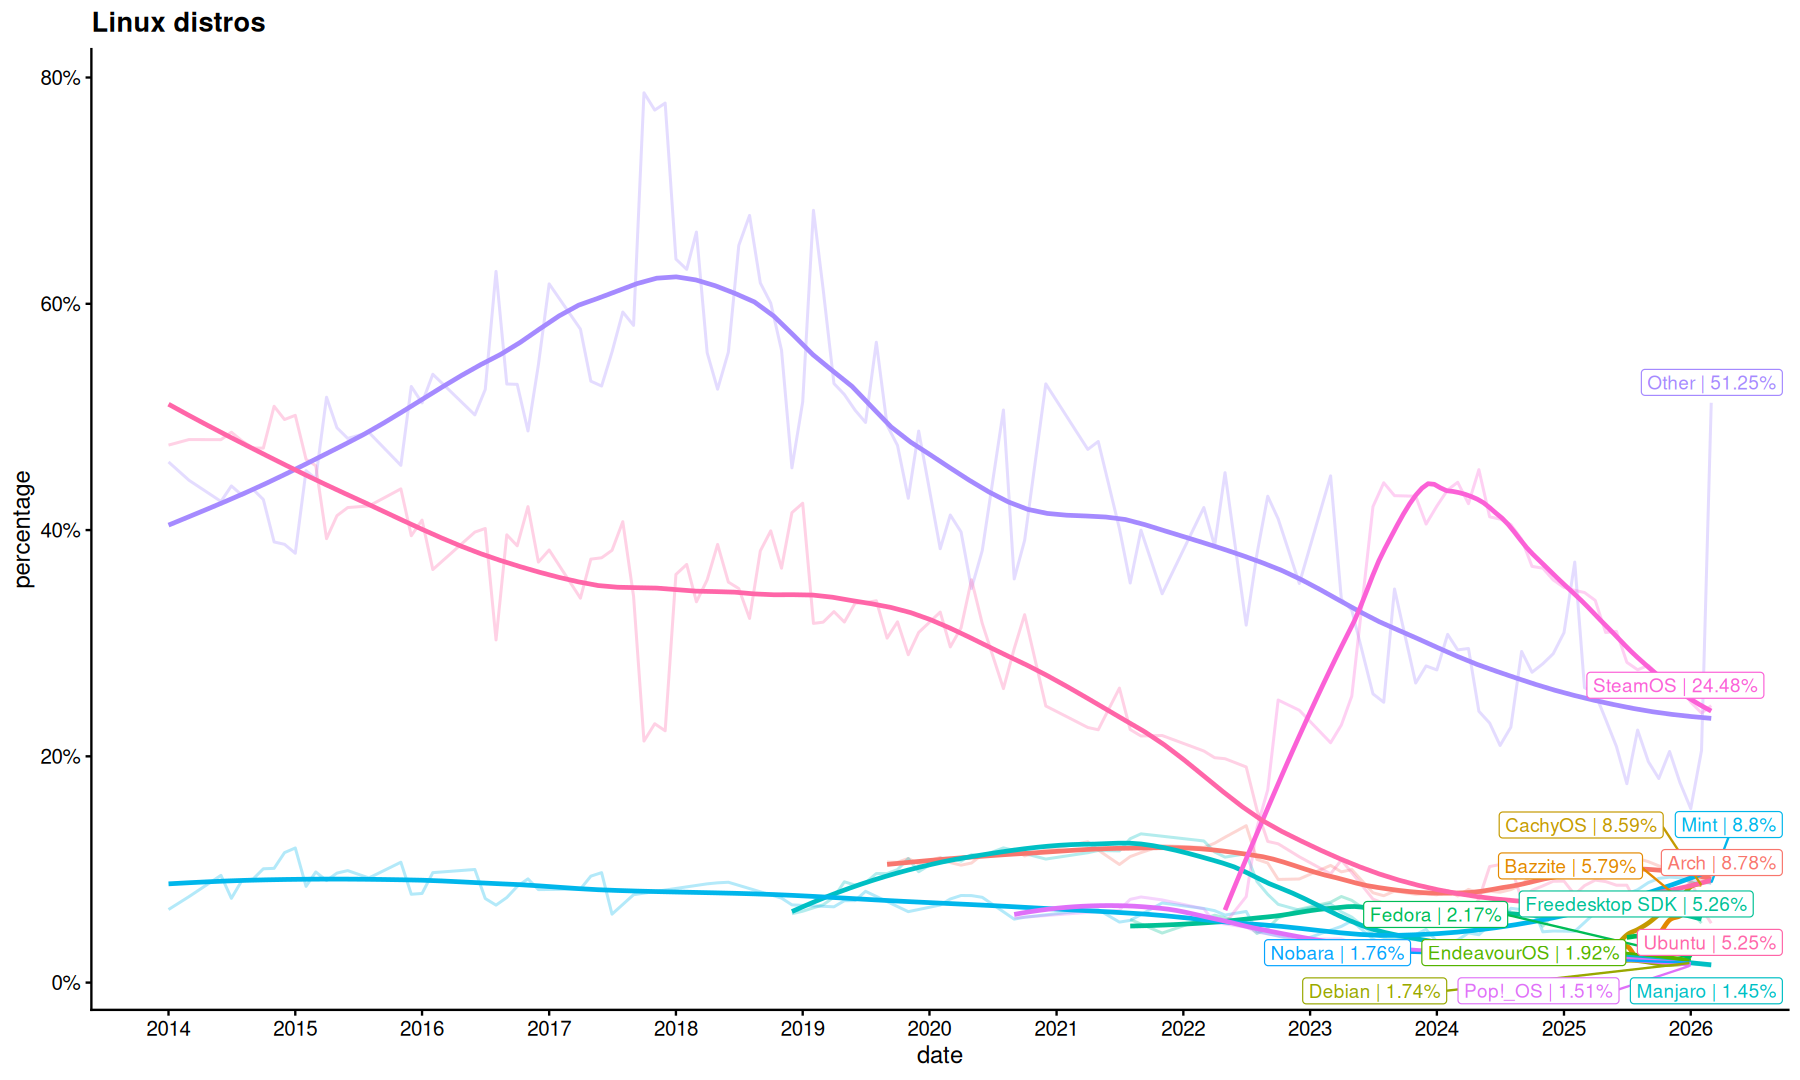
Interesting to observe that Ubuntu went from the most popular distro in 2014 to 5% usage in 2026.
SteamOS is currently the most popular but it is on a declining trend.
There is a lot of “Other”, that cannot be identified by the data:
filter(df_distro, distro=='Other', date==max(date)) |>
summarize(
    percentage=sum(percentage),
    .by=name
)“Freedesktop SDK” seems to be Steam packaged with Flatpak, but it is not present in latest 2026-03 month.
filter(df_distro, grepl('Freedesktop', distro)) |>
slice_max(date, n=1, by=name)MacOS version
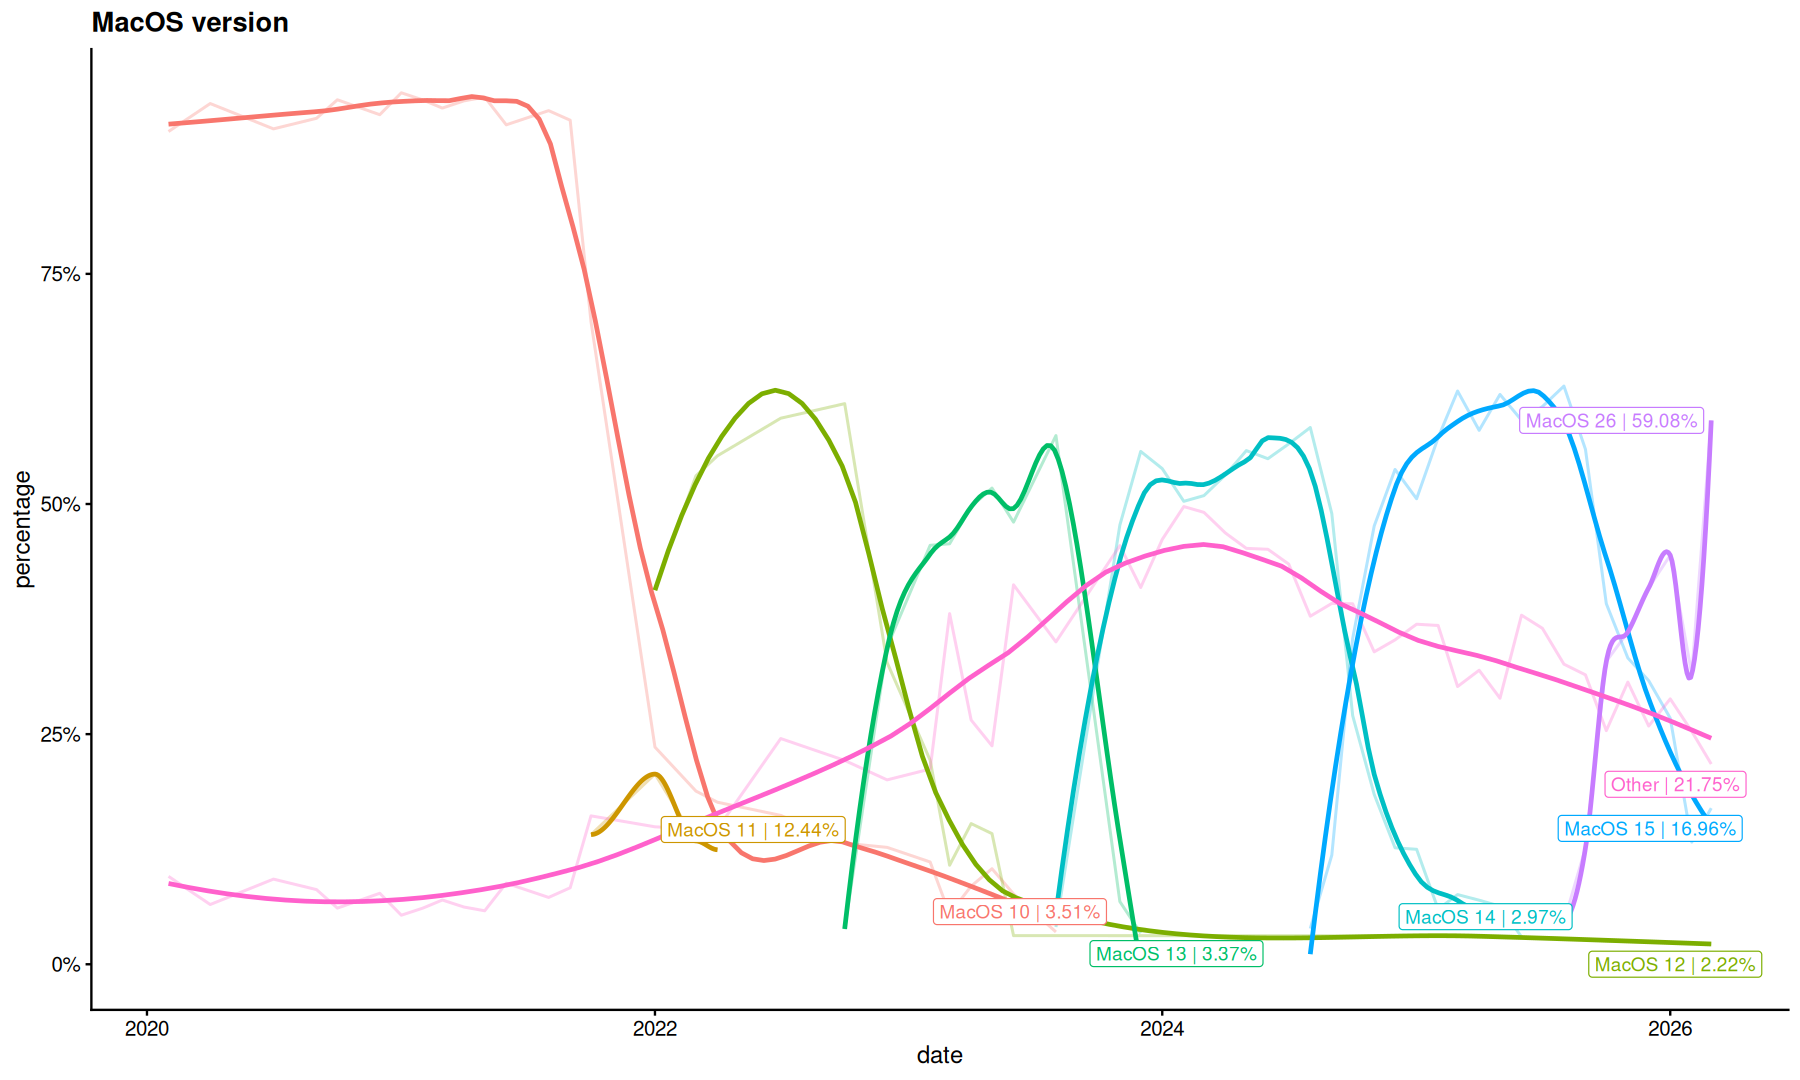
filter(df_plat, platform=='mac', category=='OSX Version') |>
mutate(
    ver=str_extract(name, '(MacOS \\d+)', group=1),
    ver=replace_na(ver, 'Other')
) |>
summarize(
    percentage=sum(percentage),
    .by=c(date, ver)
) |>
filter(date > ymd('2020-01-01')) |>
mutate(label=ifelse(date==max(date, na.rm=T), sprintf("%s | %.4g%%",ver,percentage*100), NA), .by=ver) |>
ggplot(aes(x=date, y=percentage, color=ver)) +
geom_line(alpha=0.3) +
geom_smooth(se=F, span=0.5, linewidth=1) +
geom_label_repel(aes(label=label), max.overlaps = Inf) +
labs(title='MacOS version') +
scale_y_continuous(labels=percent_format()) +
guides(color='none') -> p
suppressWarnings(print(p))
`geom_smooth()` using method = 'loess' and formula = 'y ~ x'
Windows version
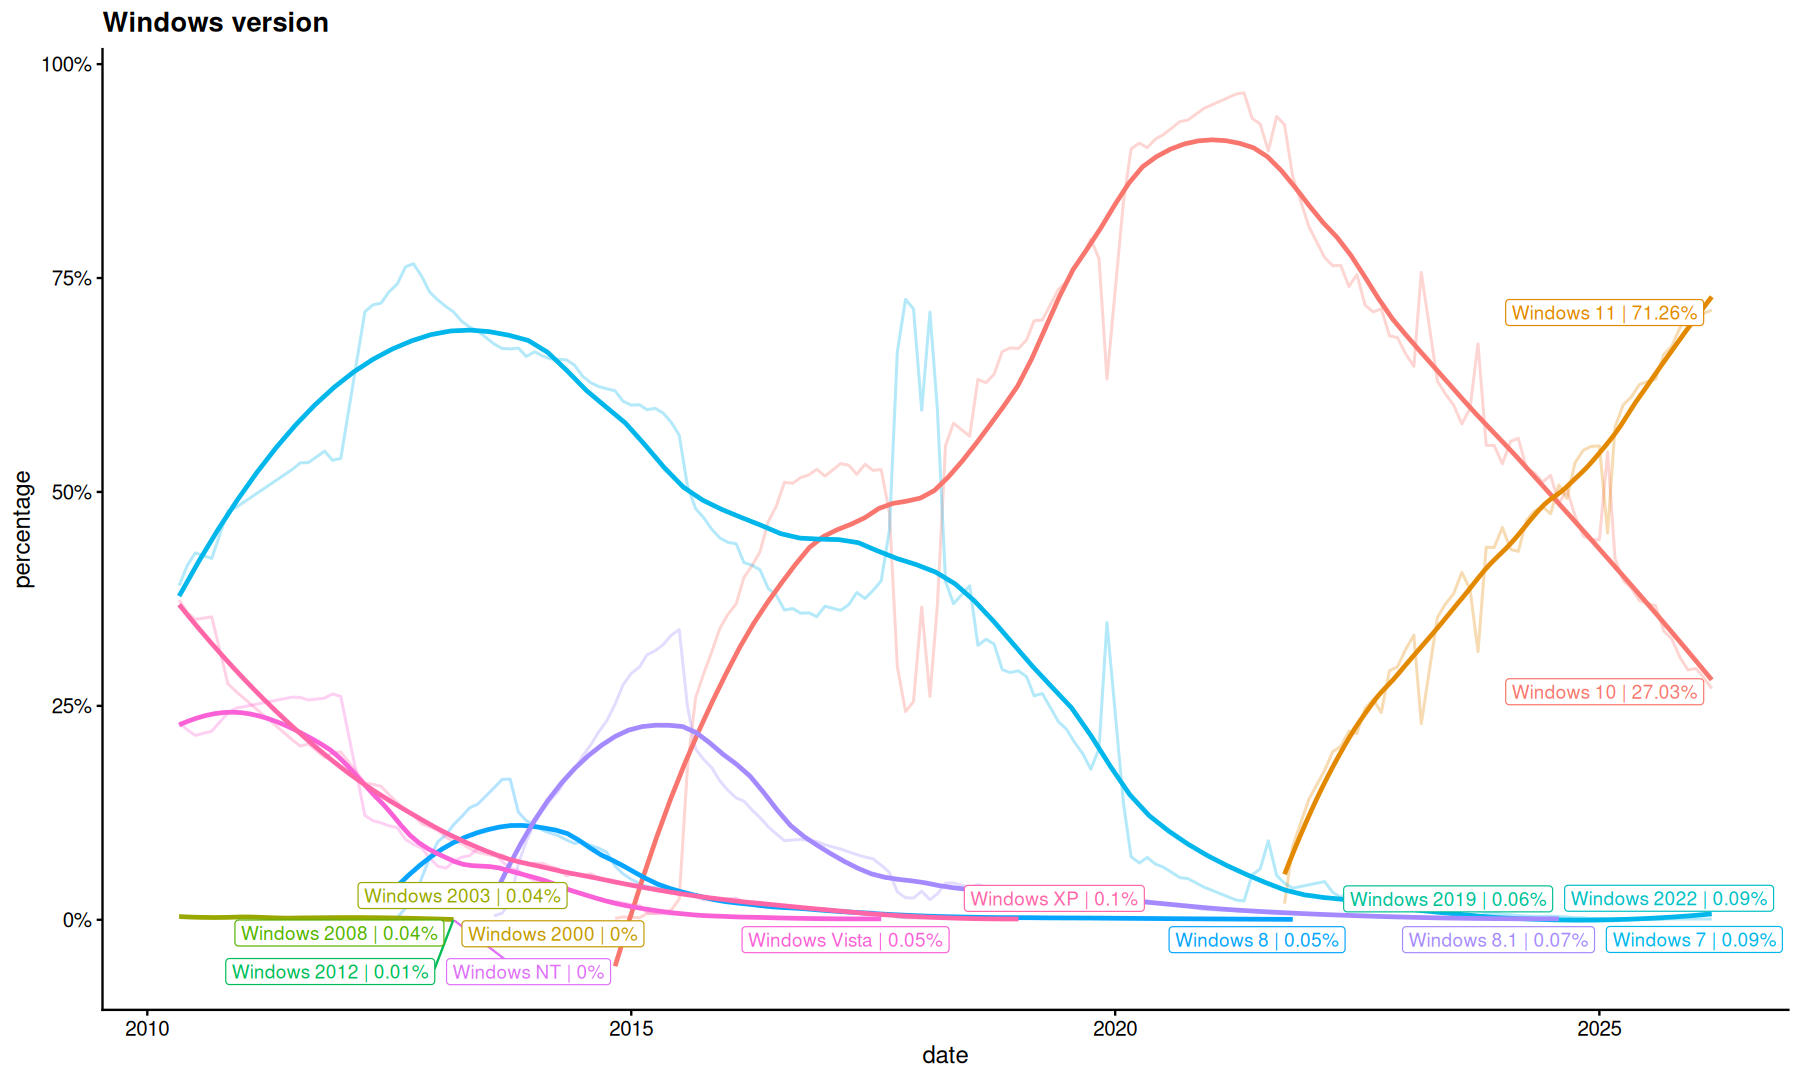
filter(df_plat, platform=='pc', grepl('Windows Version',category)) |>
filter(grepl('Windows', name)) |>
mutate(
    ver=gsub(' (64|32) bit','', name)
) |>
summarize(
    percentage=sum(percentage),
    .by = c(date, ver)
) |>
mutate(label=ifelse(date==max(date, na.rm=T), sprintf("%s | %.4g%%",ver,percentage*100), NA), .by=ver) |>
ggplot(aes(x=date, y=percentage, color=ver)) +
geom_line(alpha=0.3) +
geom_smooth(se=F, span=0.5, linewidth=1) +
geom_label_repel(aes(label=label), max.overlaps = Inf) +
labs(title='Windows version') +
guides(color='none') +
scale_y_continuous(labels=percent_format()) -> p
suppressWarnings(print(p))
`geom_smooth()` using method = 'loess' and formula = 'y ~ x'
Display Resolution
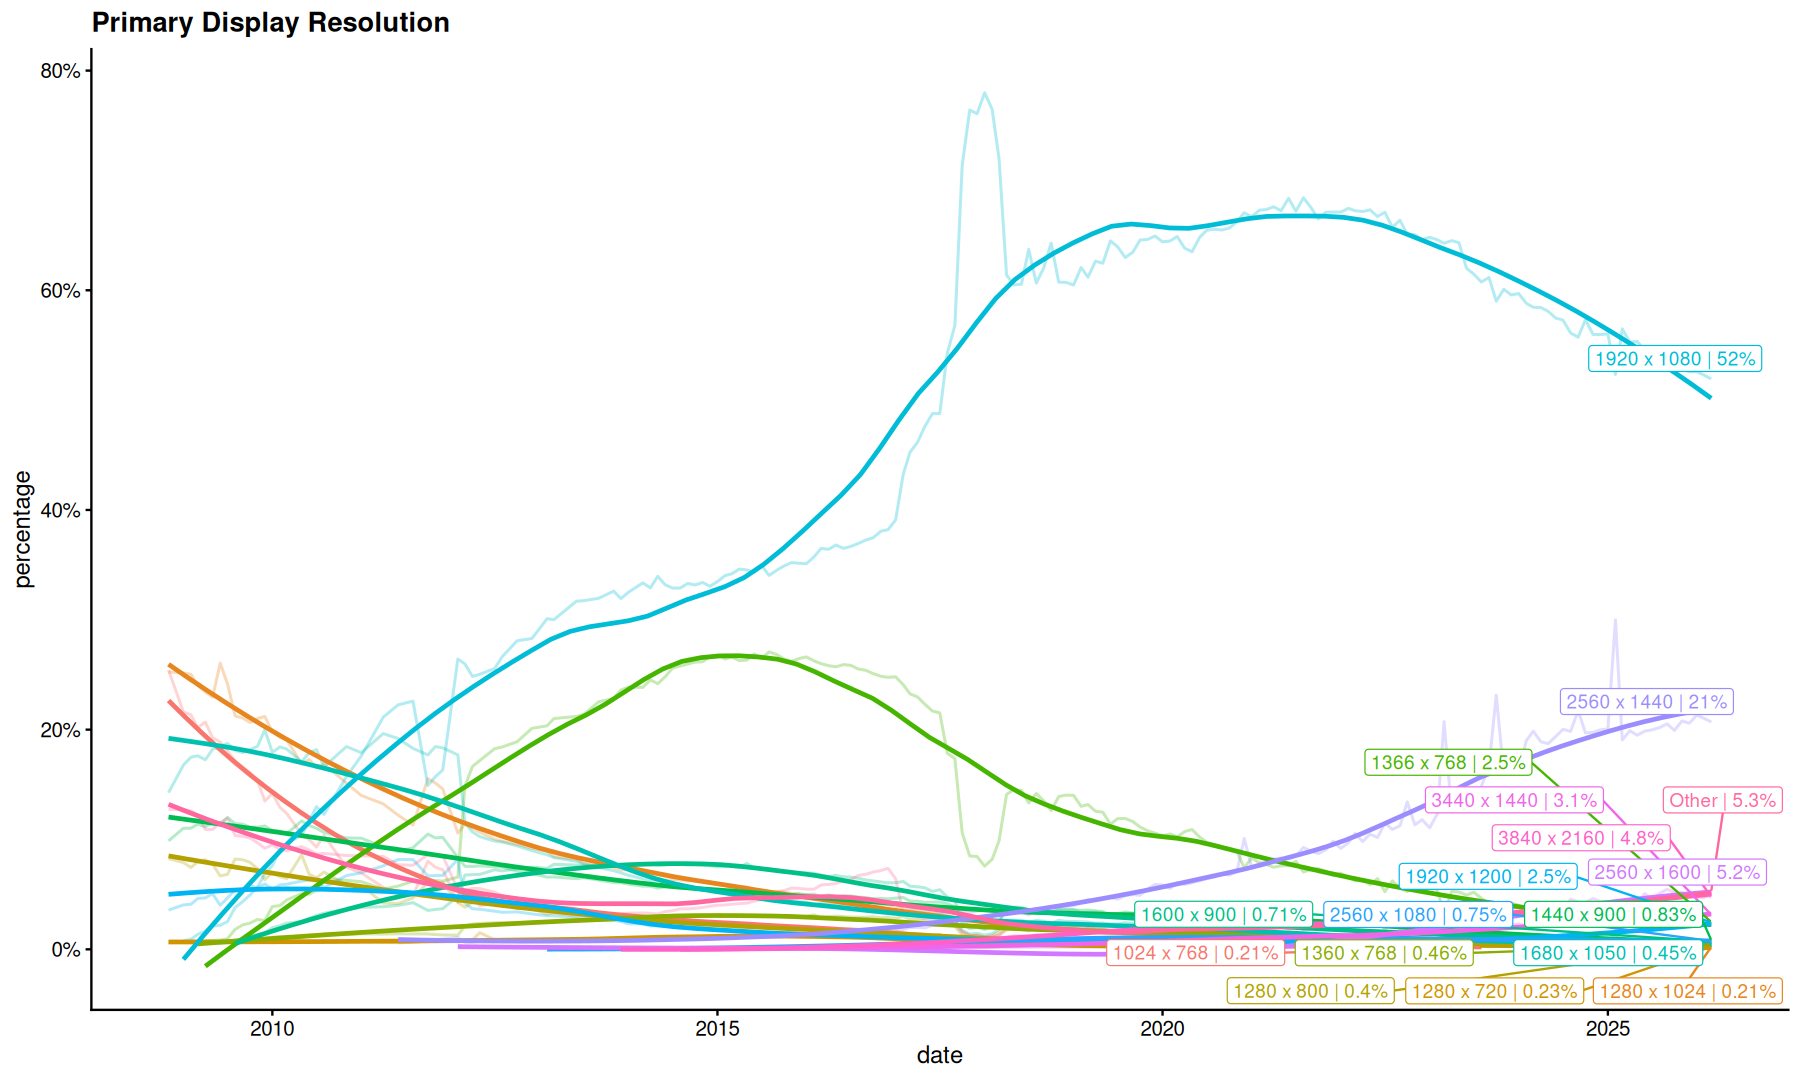
filter(df, category=='Primary Display Resolution') |>
mutate(
    disp = fct_lump_prop(name, w = percentage, prop = 0.005)
) |>
summarize(
    percentage=sum(percentage),
    .by=c(date, disp)
) |>
mutate(label=ifelse(date==max(date, na.rm=T), sprintf('%s | %2.2g%%',disp,100*percentage), NA), .by=disp) |>
ggplot(aes(x=date, y=percentage, color=disp)) +
geom_line(alpha=0.3) +
geom_smooth(se=F,span=0.5, linewidth=1) +
geom_label_repel(aes(label=label), max.overlaps = Inf) +
scale_y_continuous(labels=scales::percent_format()) +
labs(title='Primary Display Resolution') +
guides(color='none')
`geom_smooth()` using method = 'loess' and formula = 'y ~ x'
Warning message:
"Removed 2864 rows containing missing values or values outside the scale range (`geom_label_repel()`)."
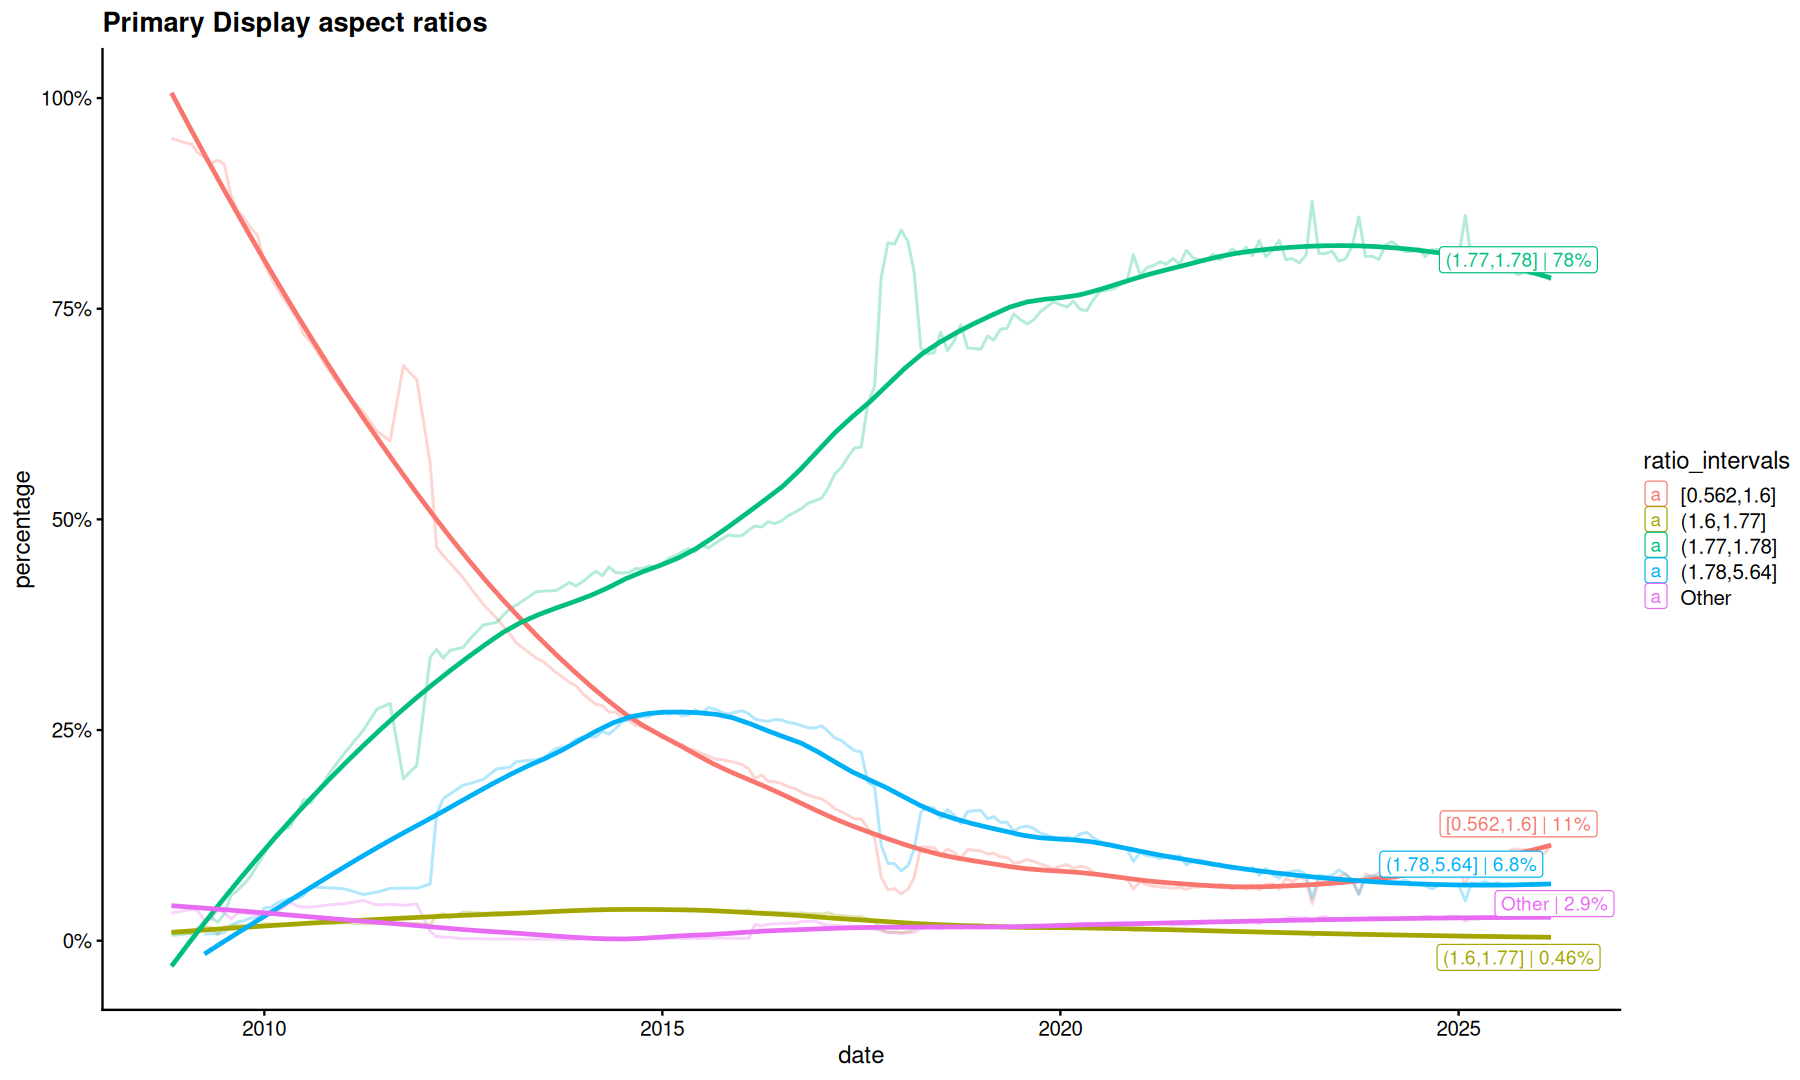
filter(df, category=='Primary Display Resolution') |>
mutate(
    w = as.numeric(str_extract(name, '^(\\d+)', group=1)),
    h = as.numeric(str_extract(name, 'x (\\d+)', group=1)),
    ratio = w/h,
    ratio_intervals = cut(ratio, breaks=quantile(ratio, na.rm=TRUE), include.lowest = TRUE),
    ratio_intervals = fct_na_value_to_level(ratio_intervals, level = 'Other')
) |>
summarize(
    percentage=sum(percentage),
    .by = c(date, ratio_intervals)
) |>
mutate(label=ifelse(date==max(date, na.rm=T), sprintf('%s | %2.2g%%',ratio_intervals,100*percentage), NA), .by=ratio_intervals) |>
ggplot(aes(x=date, y=percentage, color=ratio_intervals)) +
geom_line(alpha=0.3) +
geom_smooth(se=F,span=0.5, linewidth=1) +
geom_label_repel(aes(label=label)) +
scale_y_continuous(labels=scales::percent_format()) +
labs(title='Primary Display aspect ratios')
`geom_smooth()` using method = 'loess' and formula = 'y ~ x'
Warning message:
"Removed 936 rows containing missing values or values outside the scale range (`geom_label_repel()`)."
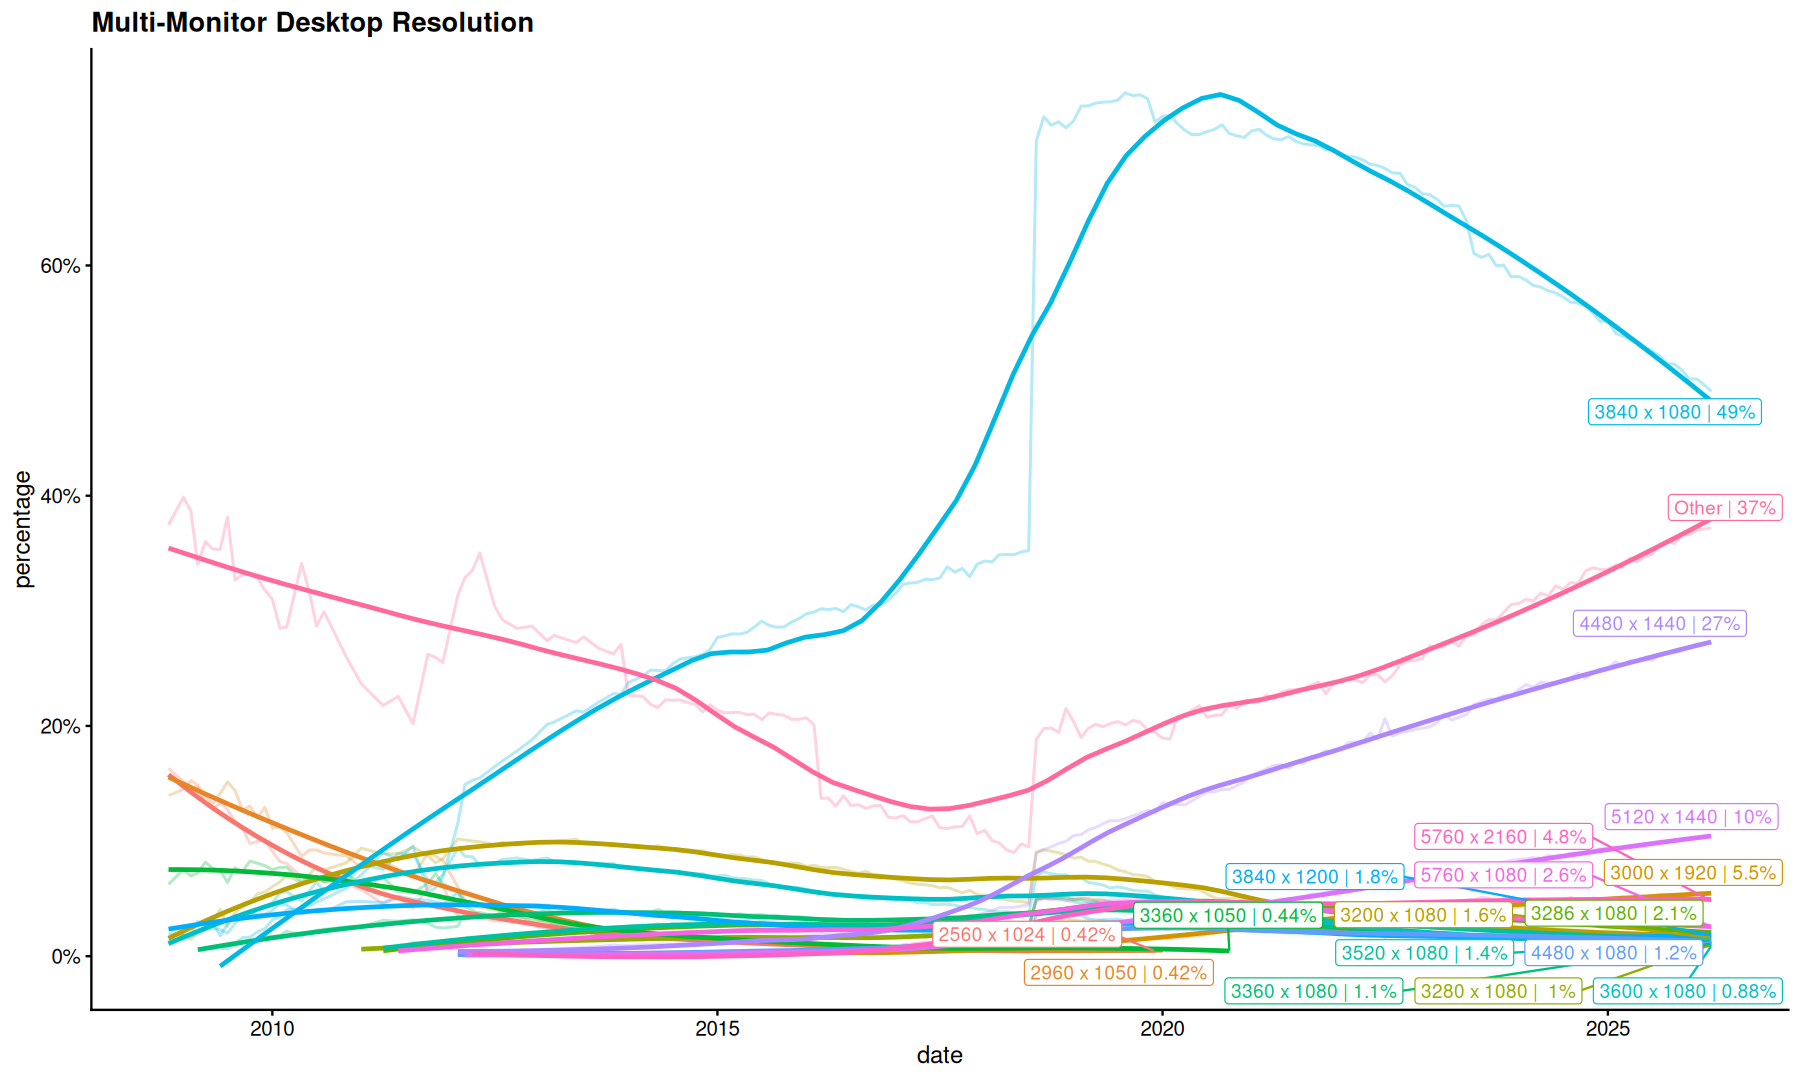
filter(df, category=='Multi-Monitor Desktop Resolution') |>
filter(name != 'Other') |>
mutate(
    disp = fct_lump_prop(name, w = percentage, prop = 0.01)
) |>
summarize(
    percentage=sum(percentage),
    .by=c(date, disp)
) |>
mutate(label=ifelse(date==max(date, na.rm=T), sprintf('%s | %2.2g%%',disp,100*percentage), NA), .by=disp) |>
ggplot(aes(x=date, y=percentage, color=disp)) +
geom_line(alpha=0.3) +
geom_smooth(se=F,span=0.5, linewidth=1) +
geom_label_repel(aes(label=label), max.overlaps = Inf) +
scale_y_continuous(labels=scales::percent_format()) +
labs(title='Multi-Monitor Desktop Resolution') +
guides(color='none')
`geom_smooth()` using method = 'loess' and formula = 'y ~ x'
Warning message:
"Removed 2906 rows containing missing values or values outside the scale range (`geom_label_repel()`)."
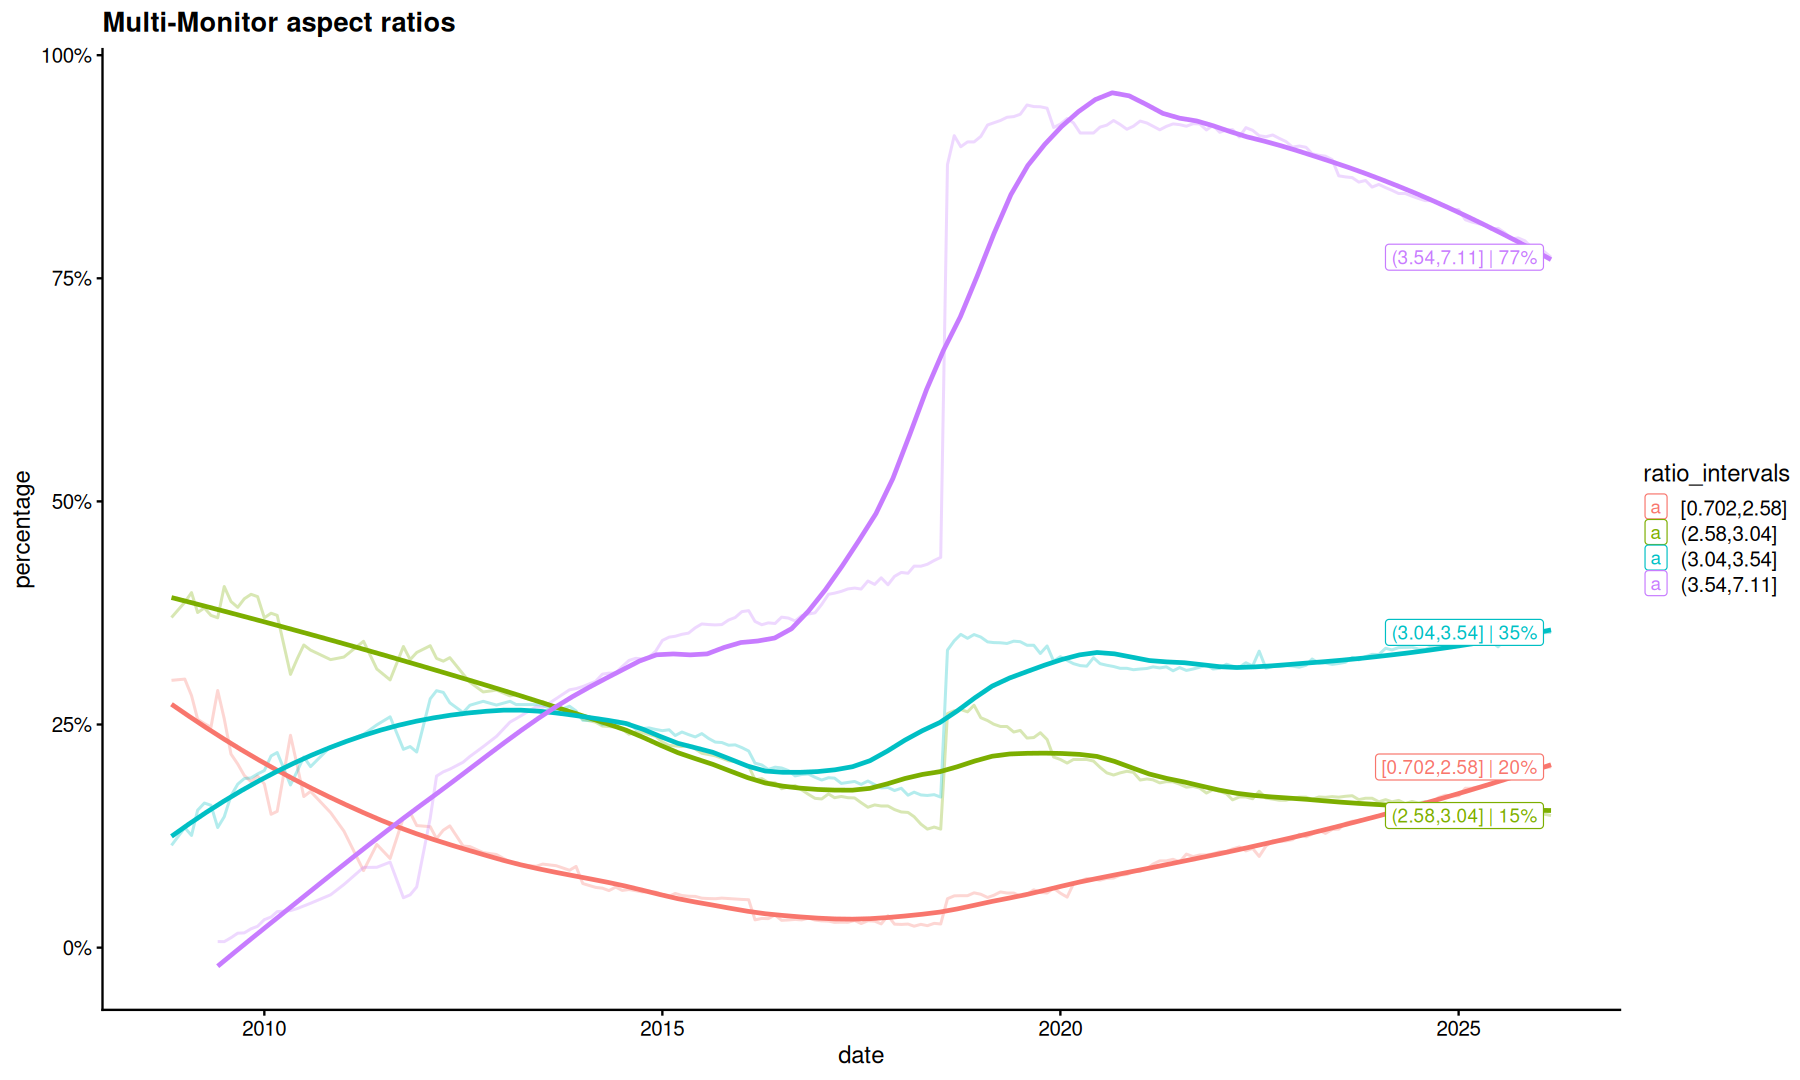
filter(df, category=='Multi-Monitor Desktop Resolution') |>
filter(name != 'Other') |>
mutate(
    w = as.numeric(str_extract(name, '^(\\d+)', group=1)),
    h = as.numeric(str_extract(name, 'x (\\d+)', group=1)),
    ratio = w/h,
    ratio_intervals = cut(ratio, breaks=quantile(ratio, na.rm=TRUE), include.lowest = TRUE),
    ratio_intervals = fct_na_value_to_level(ratio_intervals, level = 'Other')
) |>
summarize(
    percentage=sum(percentage),
    .by = c(date, ratio_intervals)
) |>
mutate(label=ifelse(date==max(date, na.rm=T), sprintf('%s | %2.2g%%',ratio_intervals,100*percentage), NA), .by=ratio_intervals) |>
ggplot(aes(x=date, y=percentage, color=ratio_intervals)) +
geom_line(alpha=0.3) +
geom_smooth(se=F,span=0.5, linewidth=1) +
scale_y_continuous(labels=scales::percent_format()) +
geom_label_repel(aes(label=label)) +
labs(title='Multi-Monitor aspect ratios')
`geom_smooth()` using method = 'loess' and formula = 'y ~ x'
Warning message:
"Removed 746 rows containing missing values or values outside the scale range (`geom_label_repel()`)."
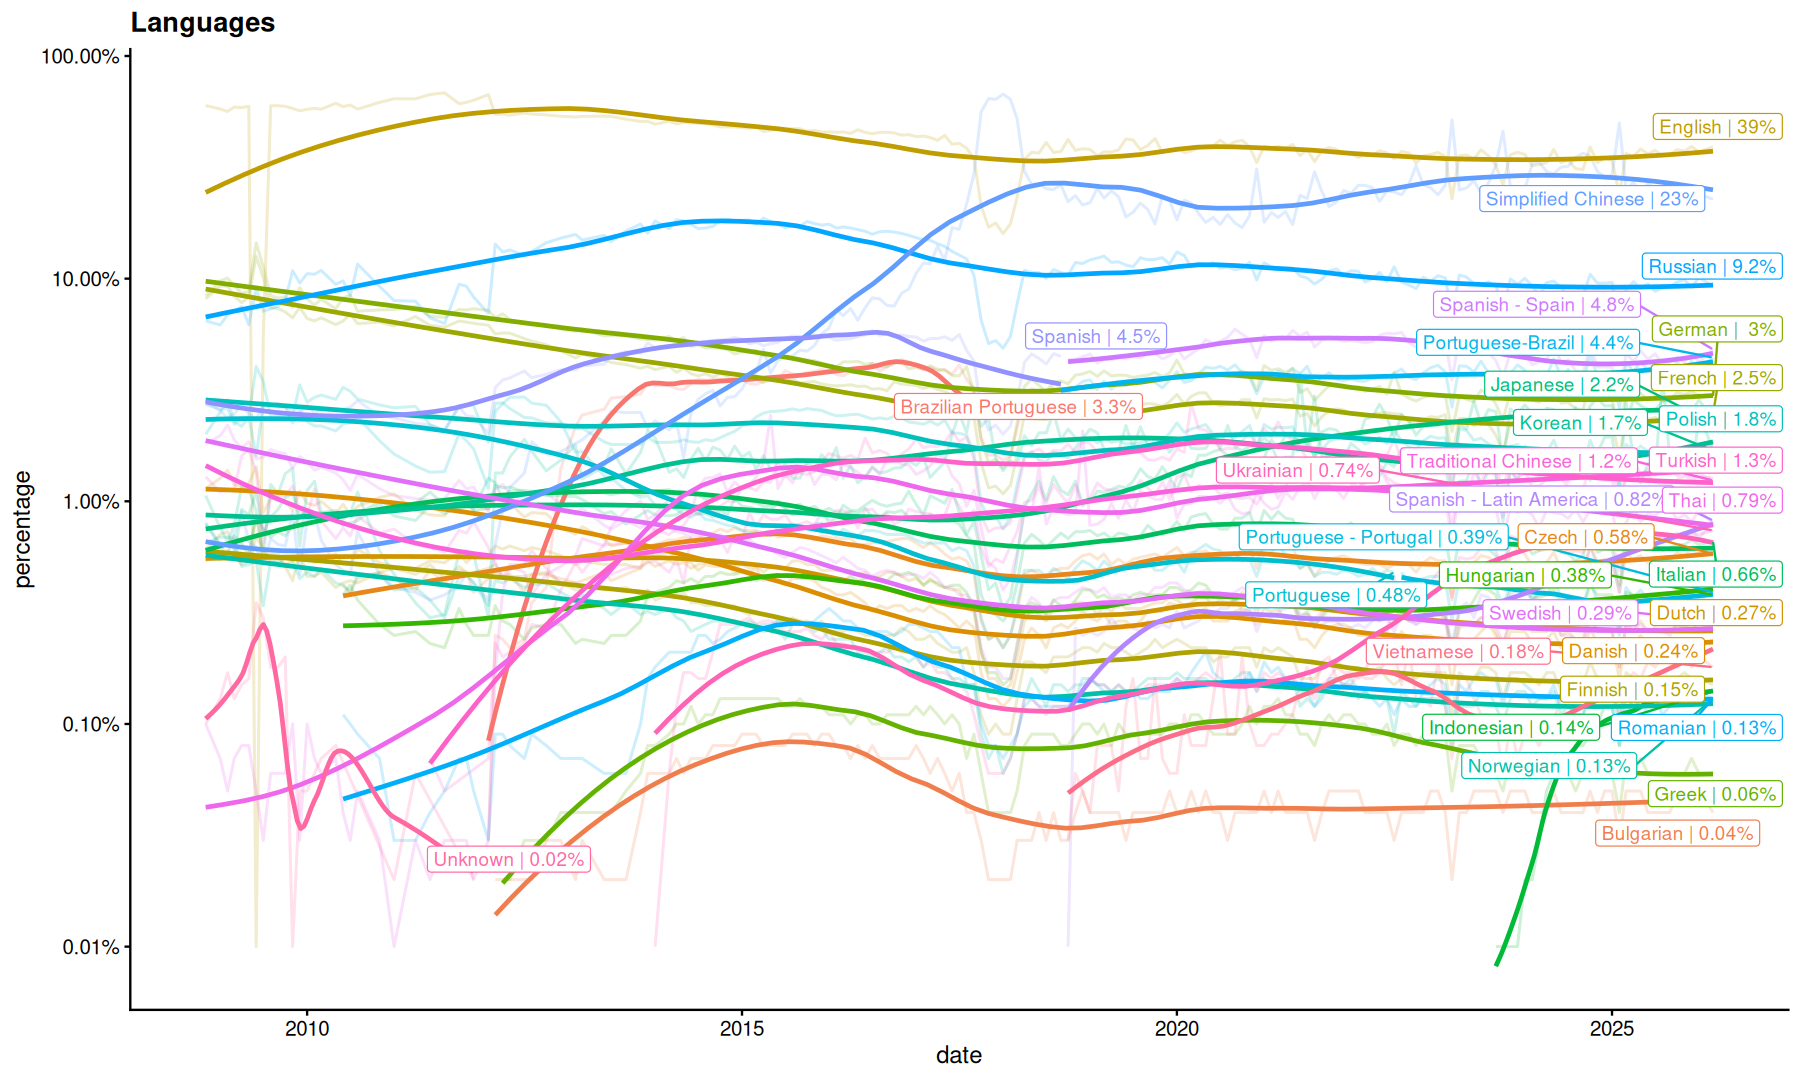
Languages
filter(df, category=='Language') |>
filter(!is.na(percentage), percentage>0) |>
mutate(label=ifelse(date==max(date, na.rm=T), sprintf('%s | %2.2g%%',name,100*percentage), NA), .by=name) |>
ggplot(aes(x=date, y=percentage, color=name)) +
geom_line(alpha=0.2) +
geom_smooth(se=F,span=0.5, linewidth=1) +
geom_label_repel(aes(label=label), max.overlaps = Inf) +
scale_y_continuous(trans='log10', labels=scales::percent_format()) +
labs(title='Languages') +
guides(color='none') -> p
suppressWarnings(print(p))
`geom_smooth()` using method = 'loess' and formula = 'y ~ x'
filter(df, category=='Language') |>
filter(date==max(date)) |>
filter(percentage>0) |>
ggplot(aes(y=fct_reorder(name, percentage), x=percentage, fill=name)) +
geom_col() +
geom_text(aes(label=sprintf("%.2g%%",percentage*100)), hjust=-.1) +
scale_x_continuous(labels=percent_format()) +
labs(title='Languages', y=NULL) +
guides(fill='none')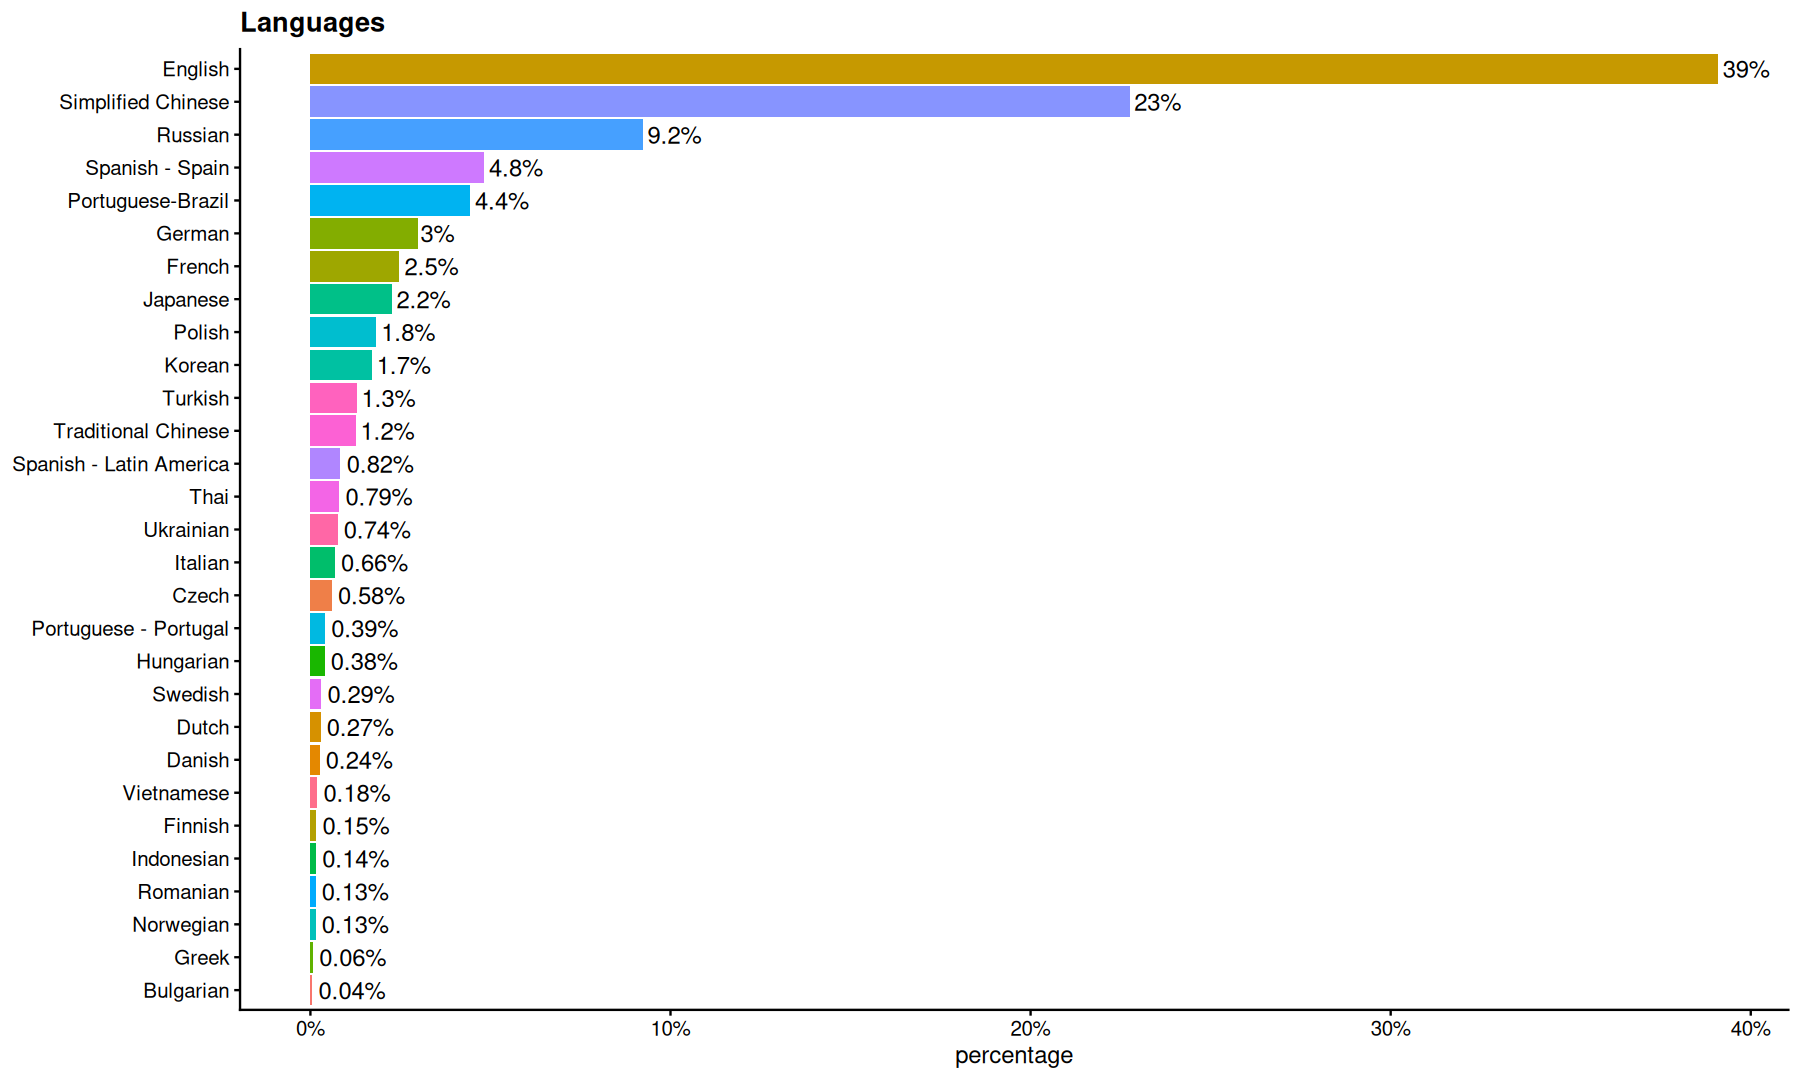
Drive Space
Total Space
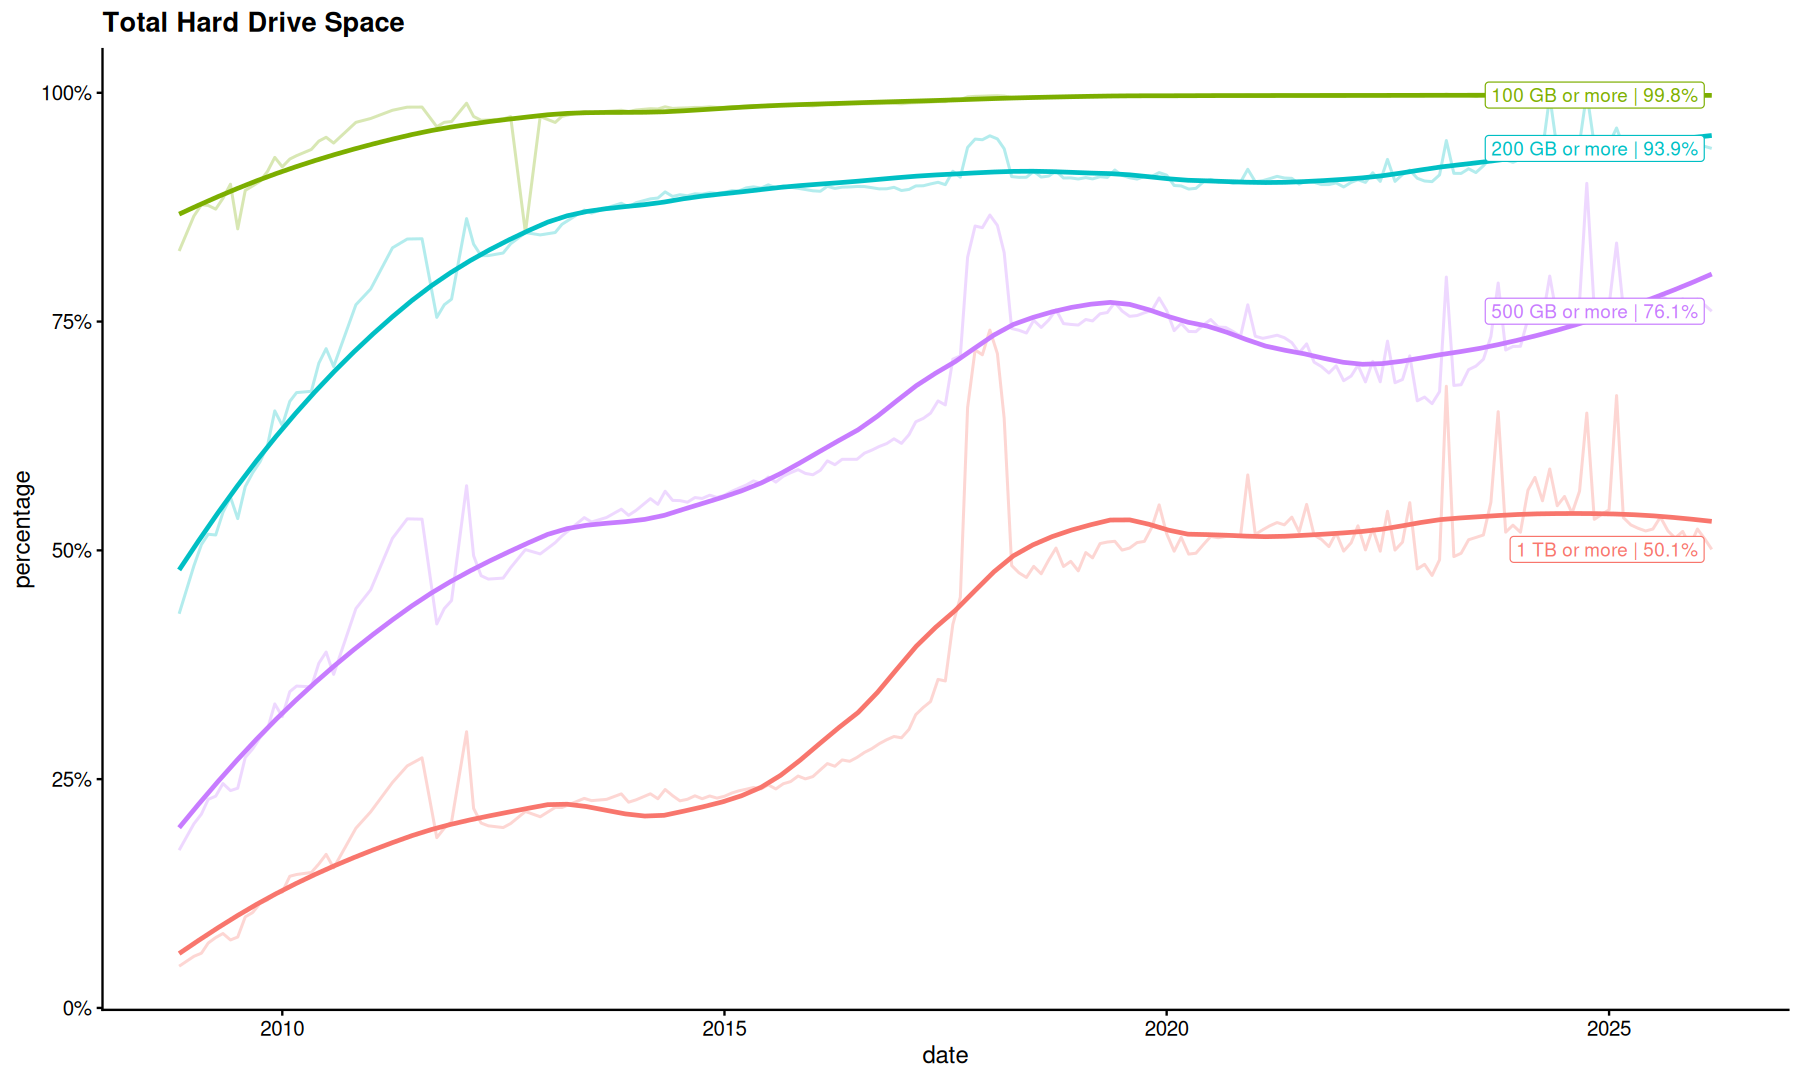
map_df(c(100, 200, 500, 1000), function(target_gb) {
    filter(df, category=='Total Hard Drive Space') |>
    mutate(
        lb_gb = case_when(
            grepl('\\d+ GB to', name) ~ as.numeric(str_extract(name, '(\\S+) GB to', group=1)),
            grepl('Above \\d+ TB', name) ~ as.numeric(str_extract(name, '(\\S+) TB', group=1))*1000,
        )
    ) |>
    filter(lb_gb >= target_gb) |>
    distinct(date, percentage) |>
    mutate(
        gb=case_when(
               target_gb >= 1000 ~ sprintf("%.3g TB or more", target_gb/1000),
               TRUE ~ sprintf("%d GB or more", target_gb)
            )
    )
}) |>
summarize(
    percentage=sum(percentage),
    .by = c(date, gb)
) |>
mutate(percentage=pmin(percentage, 1)) |>
mutate(label=ifelse(date==max(date, na.rm=T), sprintf('%s | %.3g%%', gb, percentage*100), NA), .by=gb) |>
ggplot(aes(x=date, y=percentage, color=gb)) +
geom_line(alpha=0.3) +
geom_smooth(se=F, span=0.5, linewidth=1) +
geom_label_repel(aes(label=label)) +
labs(title='Total Hard Drive Space') +
guides(color='none') +
scale_y_continuous(label=percent_format())
`geom_smooth()` using method = 'loess' and formula = 'y ~ x'
Warning message:
"Removed 752 rows containing missing values or values outside the scale range (`geom_label_repel()`)."
Free Space
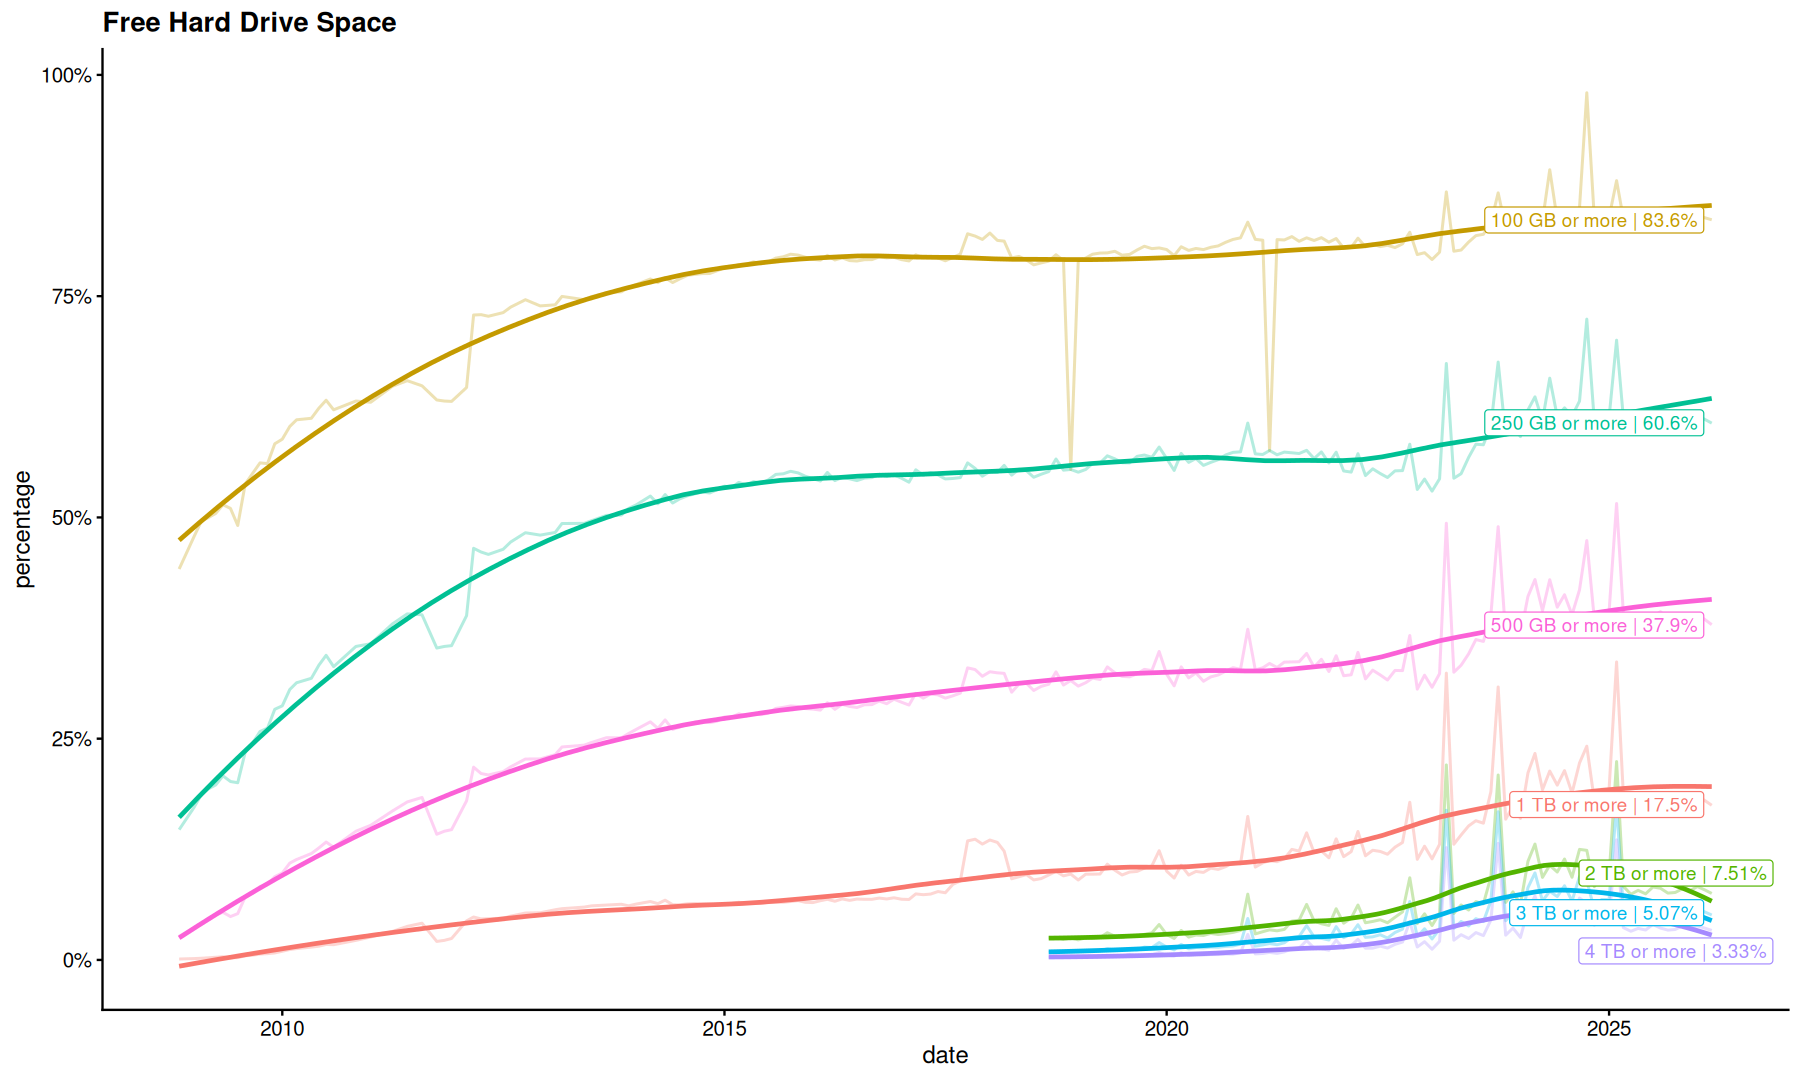
map_df(c(100, 250, 500, 1000, 2000, 3000, 4000), function(target_gb) {
    filter(df, category=='Free Hard Drive Space') |>
    mutate(
        lb_gb = case_when(
            grepl('\\d+ GB to', name) ~ as.numeric(str_extract(name, '(\\S+) GB to', group=1)),
            grepl('\\d+ TB to', name) ~ as.numeric(str_extract(name, '(\\S+) TB to', group=1))*1000,
            grepl('Above \\d+ TB', name) ~ as.numeric(str_extract(name, '(\\S+) TB', group=1))*1000,
        )
    ) |>
    filter(lb_gb >= target_gb) |>
    distinct(date, percentage) |>
    mutate(
        gb=case_when(
               target_gb >= 1000 ~ sprintf("%.3g TB or more", target_gb/1000),
               TRUE ~ sprintf("%d GB or more", target_gb)
            )
    )
}) |>
summarize(
    percentage=sum(percentage),
    .by = c(date, gb)
) |>
mutate(percentage=pmin(percentage, 1)) |>
mutate(label=ifelse(date==max(date, na.rm=T), sprintf('%s | %.3g%%', gb, percentage*100), NA), .by=gb) |>
ggplot(aes(x=date, y=percentage, color=gb)) +
geom_line(alpha=0.3) +
geom_smooth(se=F, span=0.5, linewidth=1) +
geom_label_repel(aes(label=label)) +
labs(title='Free Hard Drive Space') +
guides(color='none') +
scale_y_continuous(label=percent_format())
`geom_smooth()` using method = 'loess' and formula = 'y ~ x'
Warning message:
"Removed 1022 rows containing missing values or values outside the scale range (`geom_label_repel()`)."
VR Headsets
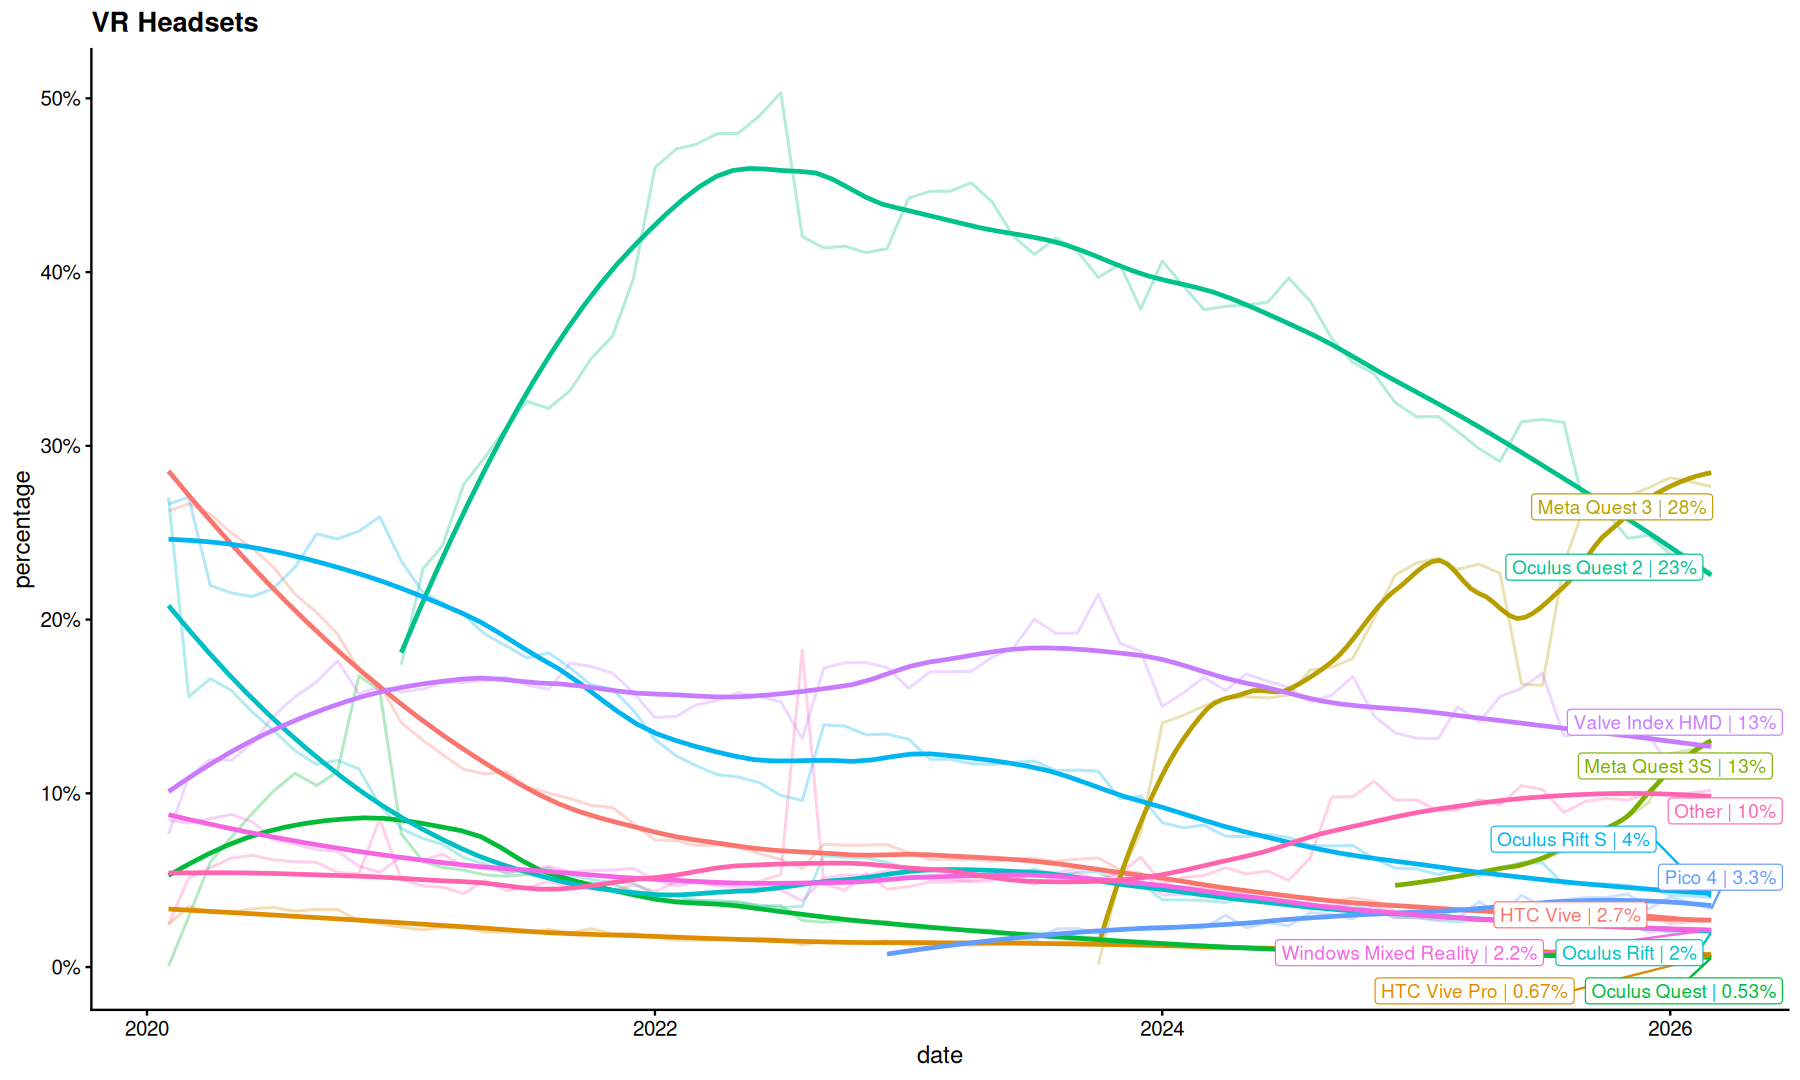
filter(df, grepl('VR ', category)) |>
filter(date > ymd('2020-01-01')) |>
mutate(
    name2=fct_lump_prop(name, w=percentage, prop=0.01)
) |>
summarize(
    percentage=sum(percentage),
    .by=c(date, name2)
) |>
mutate(label=ifelse(date==max(date, na.rm=T), sprintf('%s | %.2g%%', name2, percentage*100), NA), .by=name2) |>
ggplot(aes(x=date, y=percentage, color=name2)) +
geom_line(alpha=0.3) +
geom_smooth(se=F, span=0.5, linewidth=1) +
geom_label_repel(aes(label=label), max.overlaps = Inf) +
labs(title='VR Headsets') +
guides(color='none') +
scale_y_continuous(label=percent_format())
`geom_smooth()` using method = 'loess' and formula = 'y ~ x'
Warning message:
"Removed 729 rows containing missing values or values outside the scale range (`geom_label_repel()`)."
Other settings
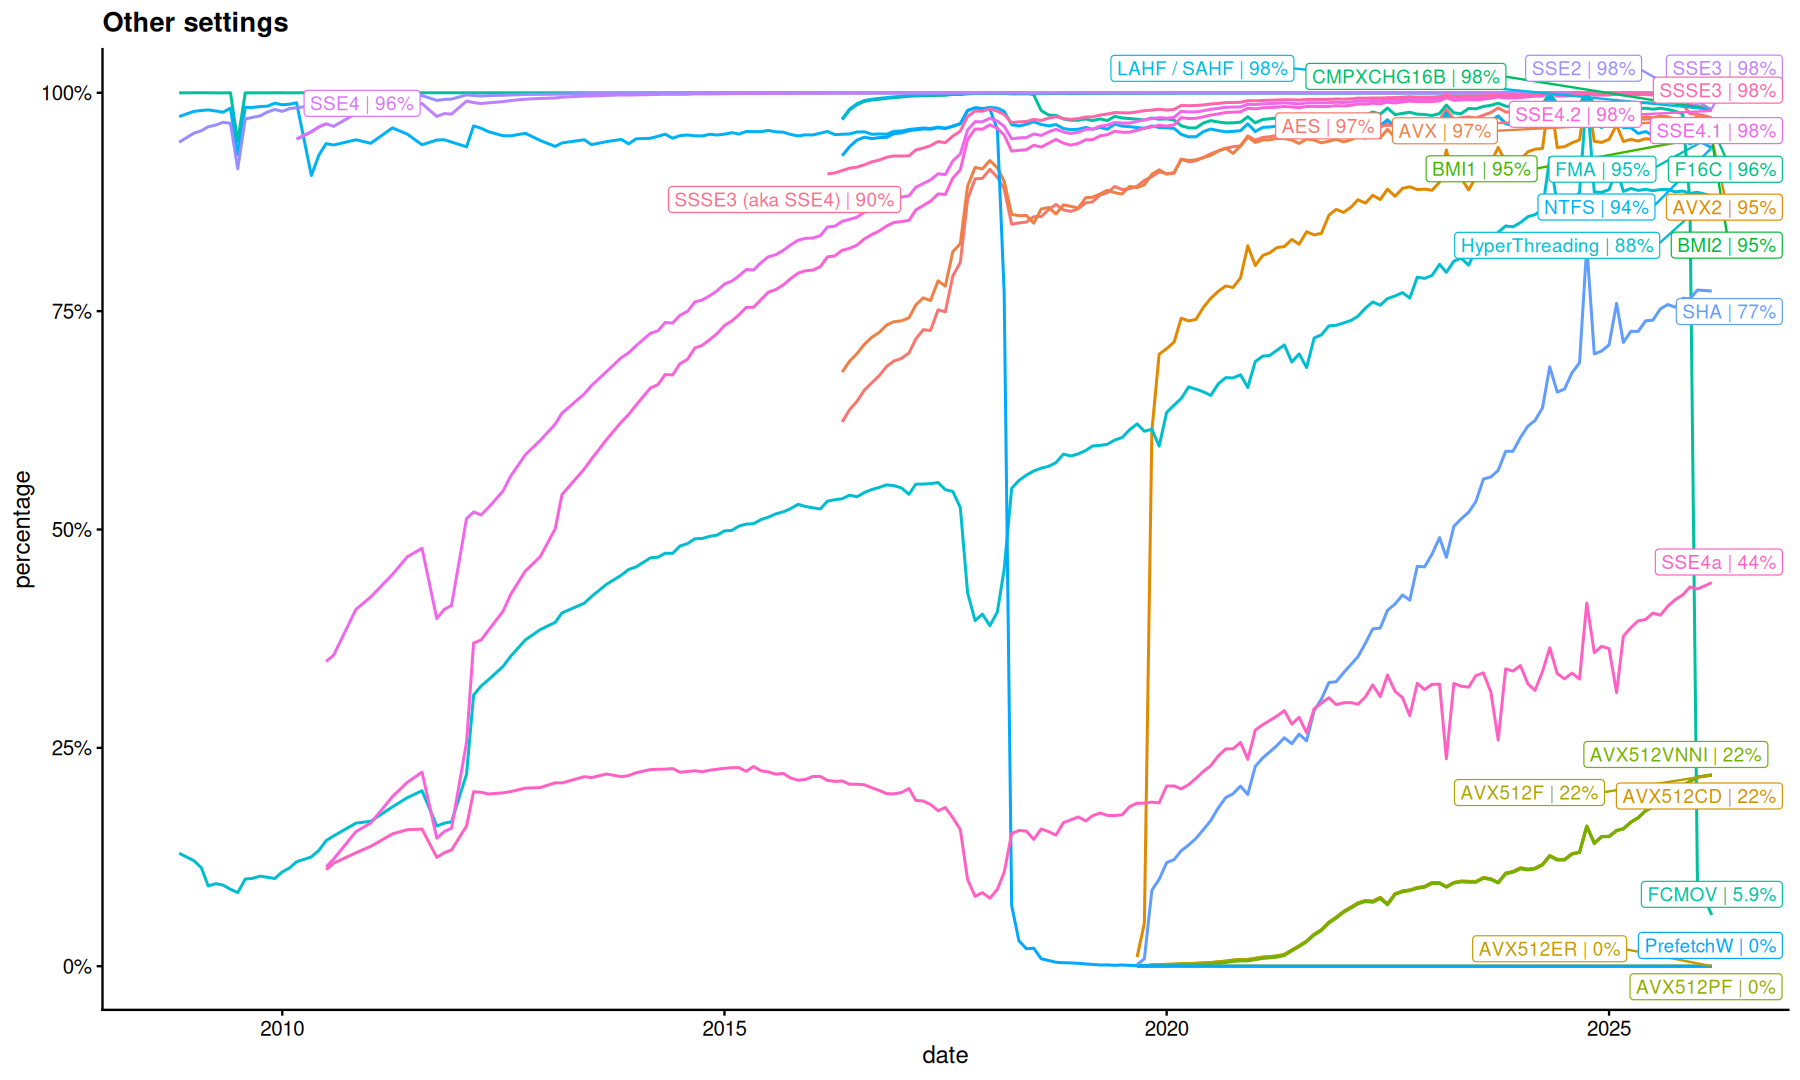
filter(df, grepl('Other', category)) |>
mutate(percentage=pmin(percentage, 1)) |>
mutate(label=ifelse(date==max(date, na.rm=T), sprintf('%s | %.2g%%', name, percentage*100), NA), .by=name) |>
ggplot(aes(x=date, y=percentage, color=name)) +
geom_line() +
guides(color='none') +
geom_label_repel(aes(label=label), max.overlaps = Inf) +
labs(title='Other settings') +
scale_y_continuous(label=percent_format())
Warning message:
"Removed 2718 rows containing missing values or values outside the scale range (`geom_label_repel()`)."