suppressPackageStartupMessages({
    library(tidyverse)
    library(cowplot)
    library(patchwork)
    theme_set(theme_cowplot())
})
options(repr.plot.width=16,repr.plot.height=10)
Composing multiple plots in a single page
p1 <- ggplot(mtcars) + geom_point(aes(mpg, disp)) + ggtitle('Plot 1')
p2 <- ggplot(mtcars) + geom_boxplot(aes(gear, disp, group = gear)) + ggtitle('Plot 2')
# from cowplot
plot_grid(p1,p2)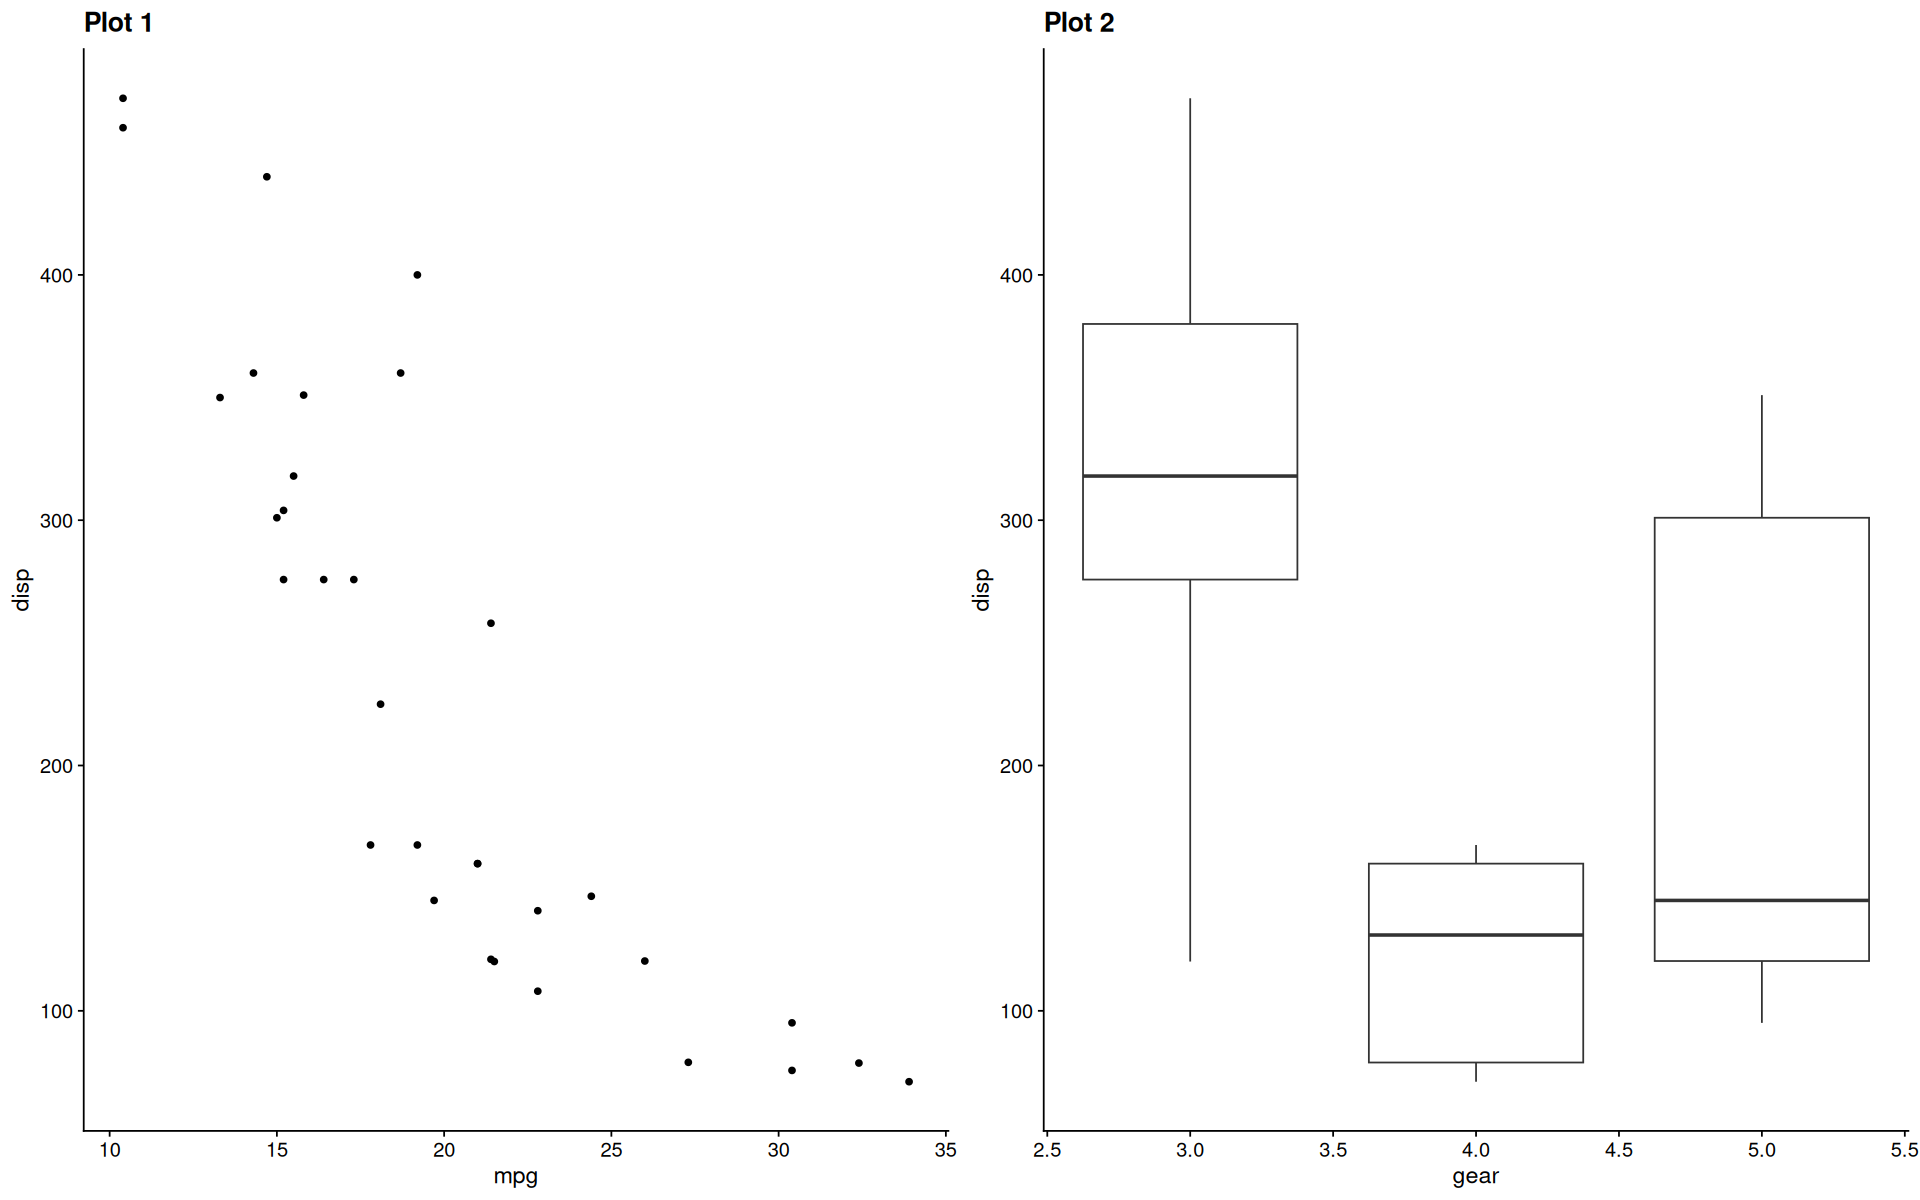
# with patchwork
(p1 / p2) | gridExtra::tableGrob(mtcars[1:10, c('mpg', 'disp')])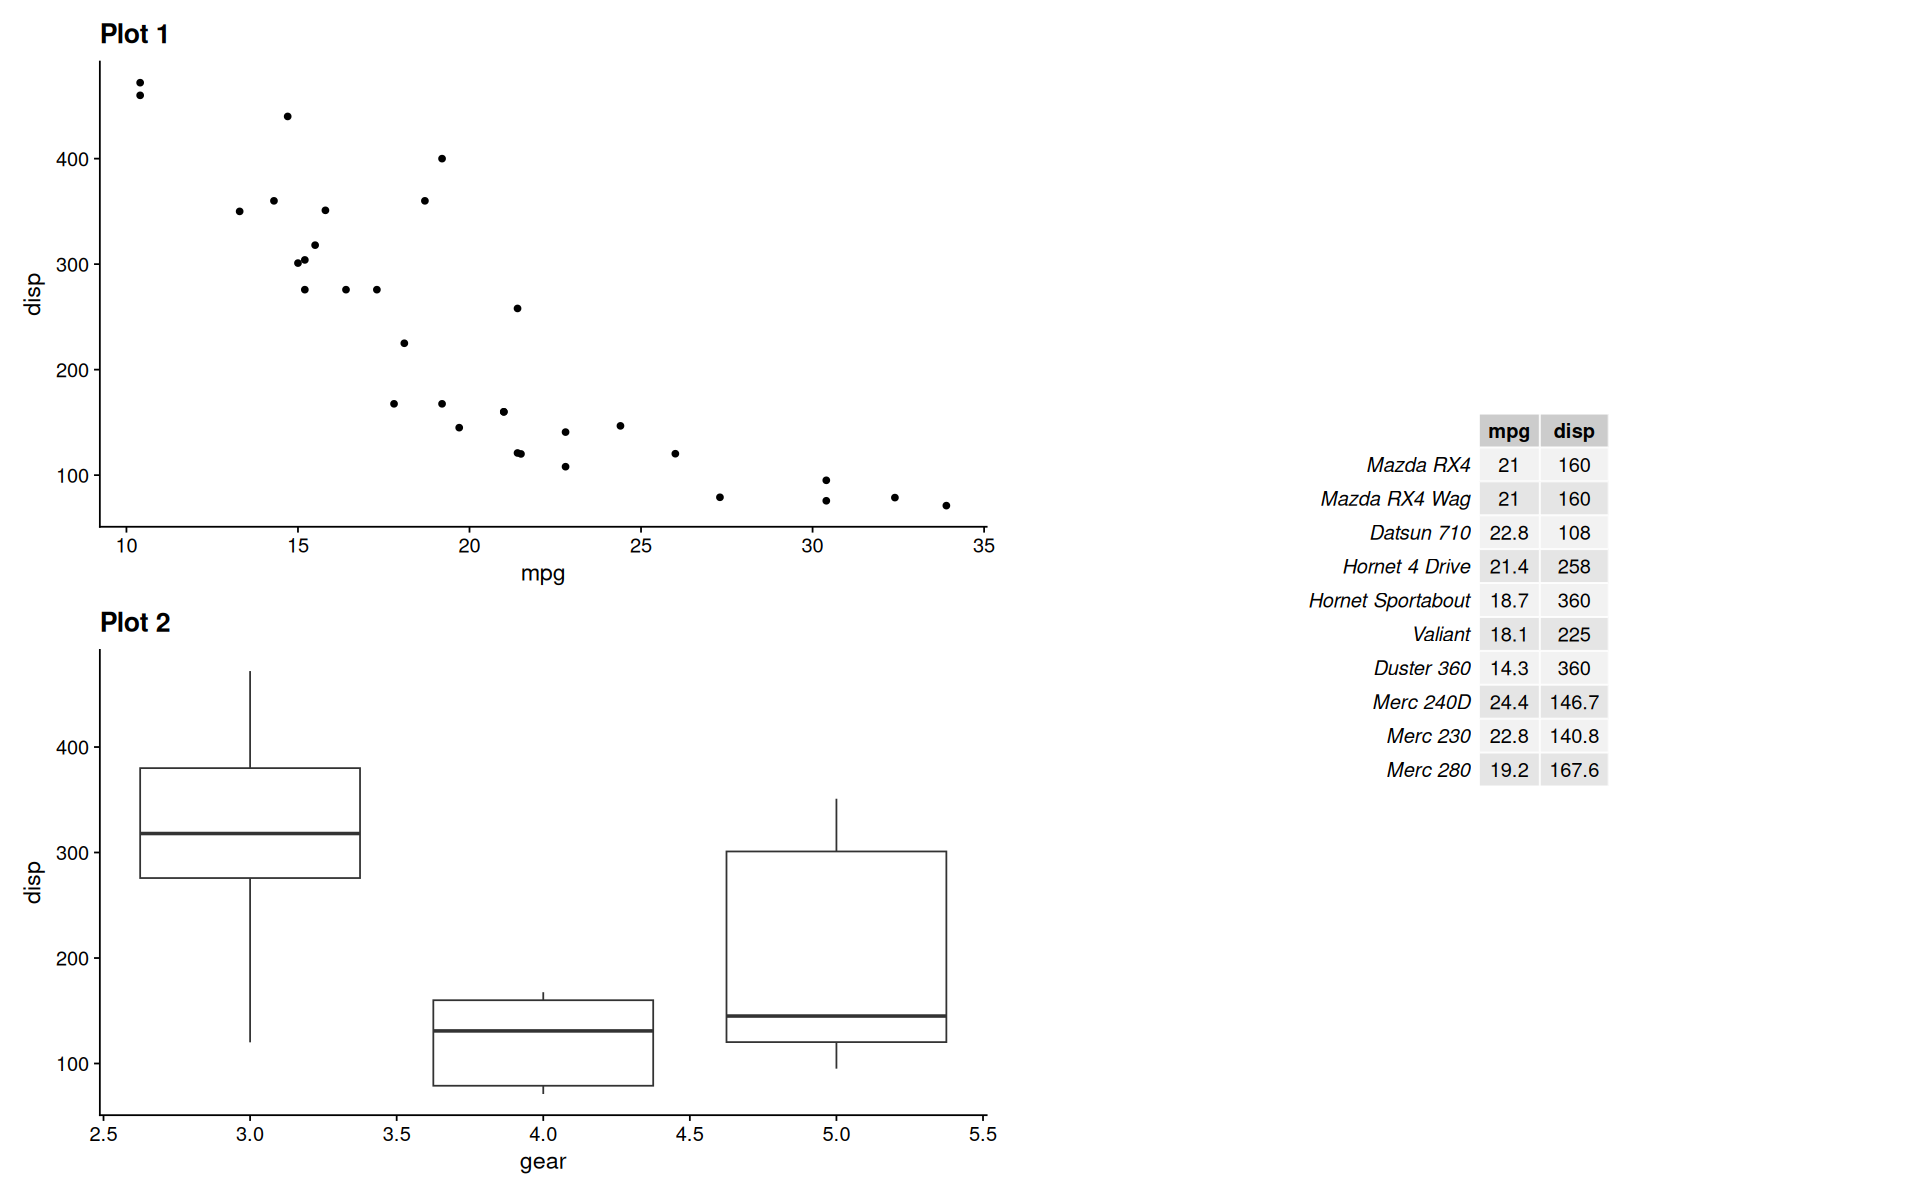
Inset plots and tables
library(ggpp)p <- ggplot(mpg, aes(factor(cyl), hwy)) +
stat_summary(geom = "col", fun = mean, width = 2/3)
ggplot(mpg, aes(displ, hwy, colour = factor(cyl))) +
annotate("plot", x = 7, y = 44, label = p) +
geom_point(size=3) 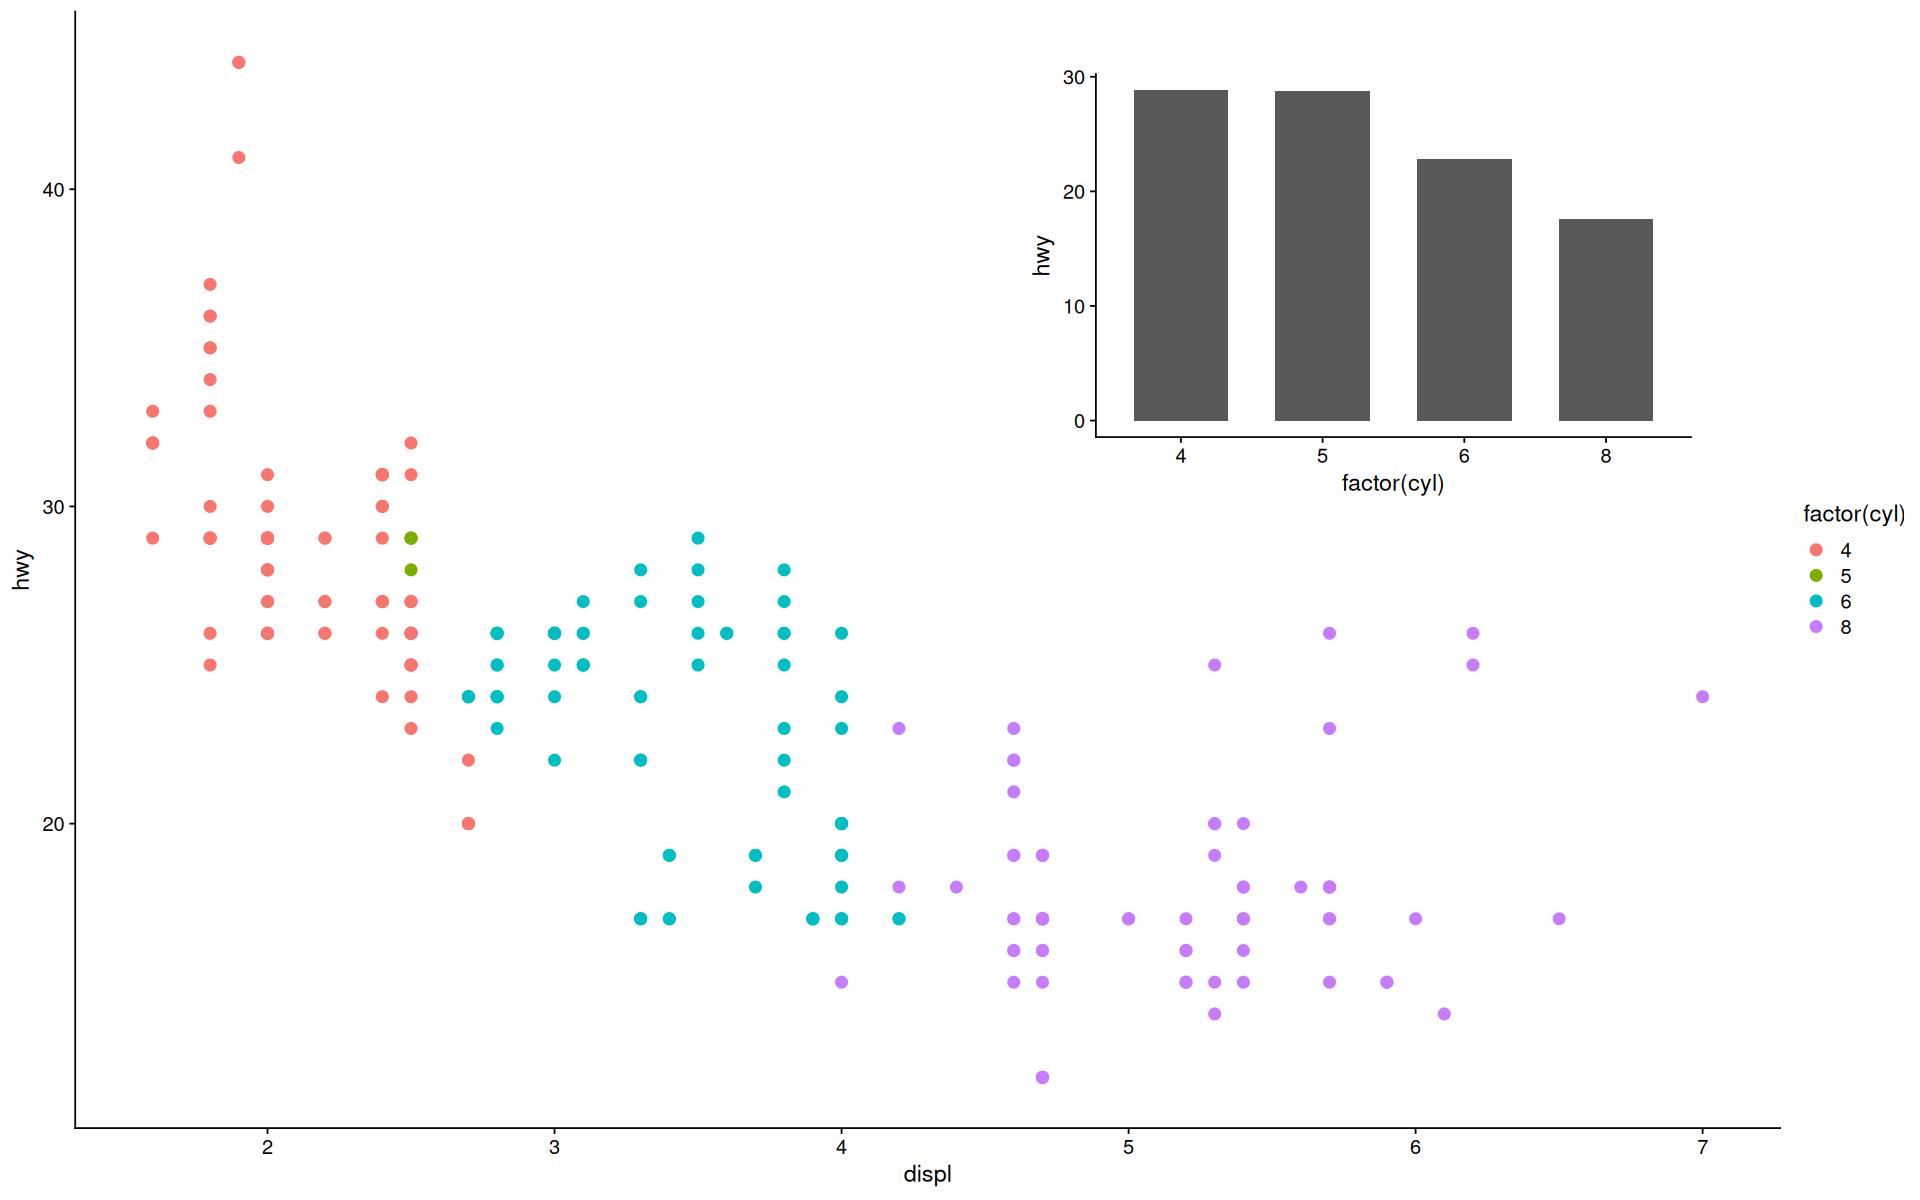
stb <- summarise(mpg, hwy = median(hwy), cty = median(cty), .by=cyl)

ggplot(mpg, aes(displ, hwy)) +
  geom_point(size=3) +
  annotate("table", x = 7, y = 44, label = stb, size=8)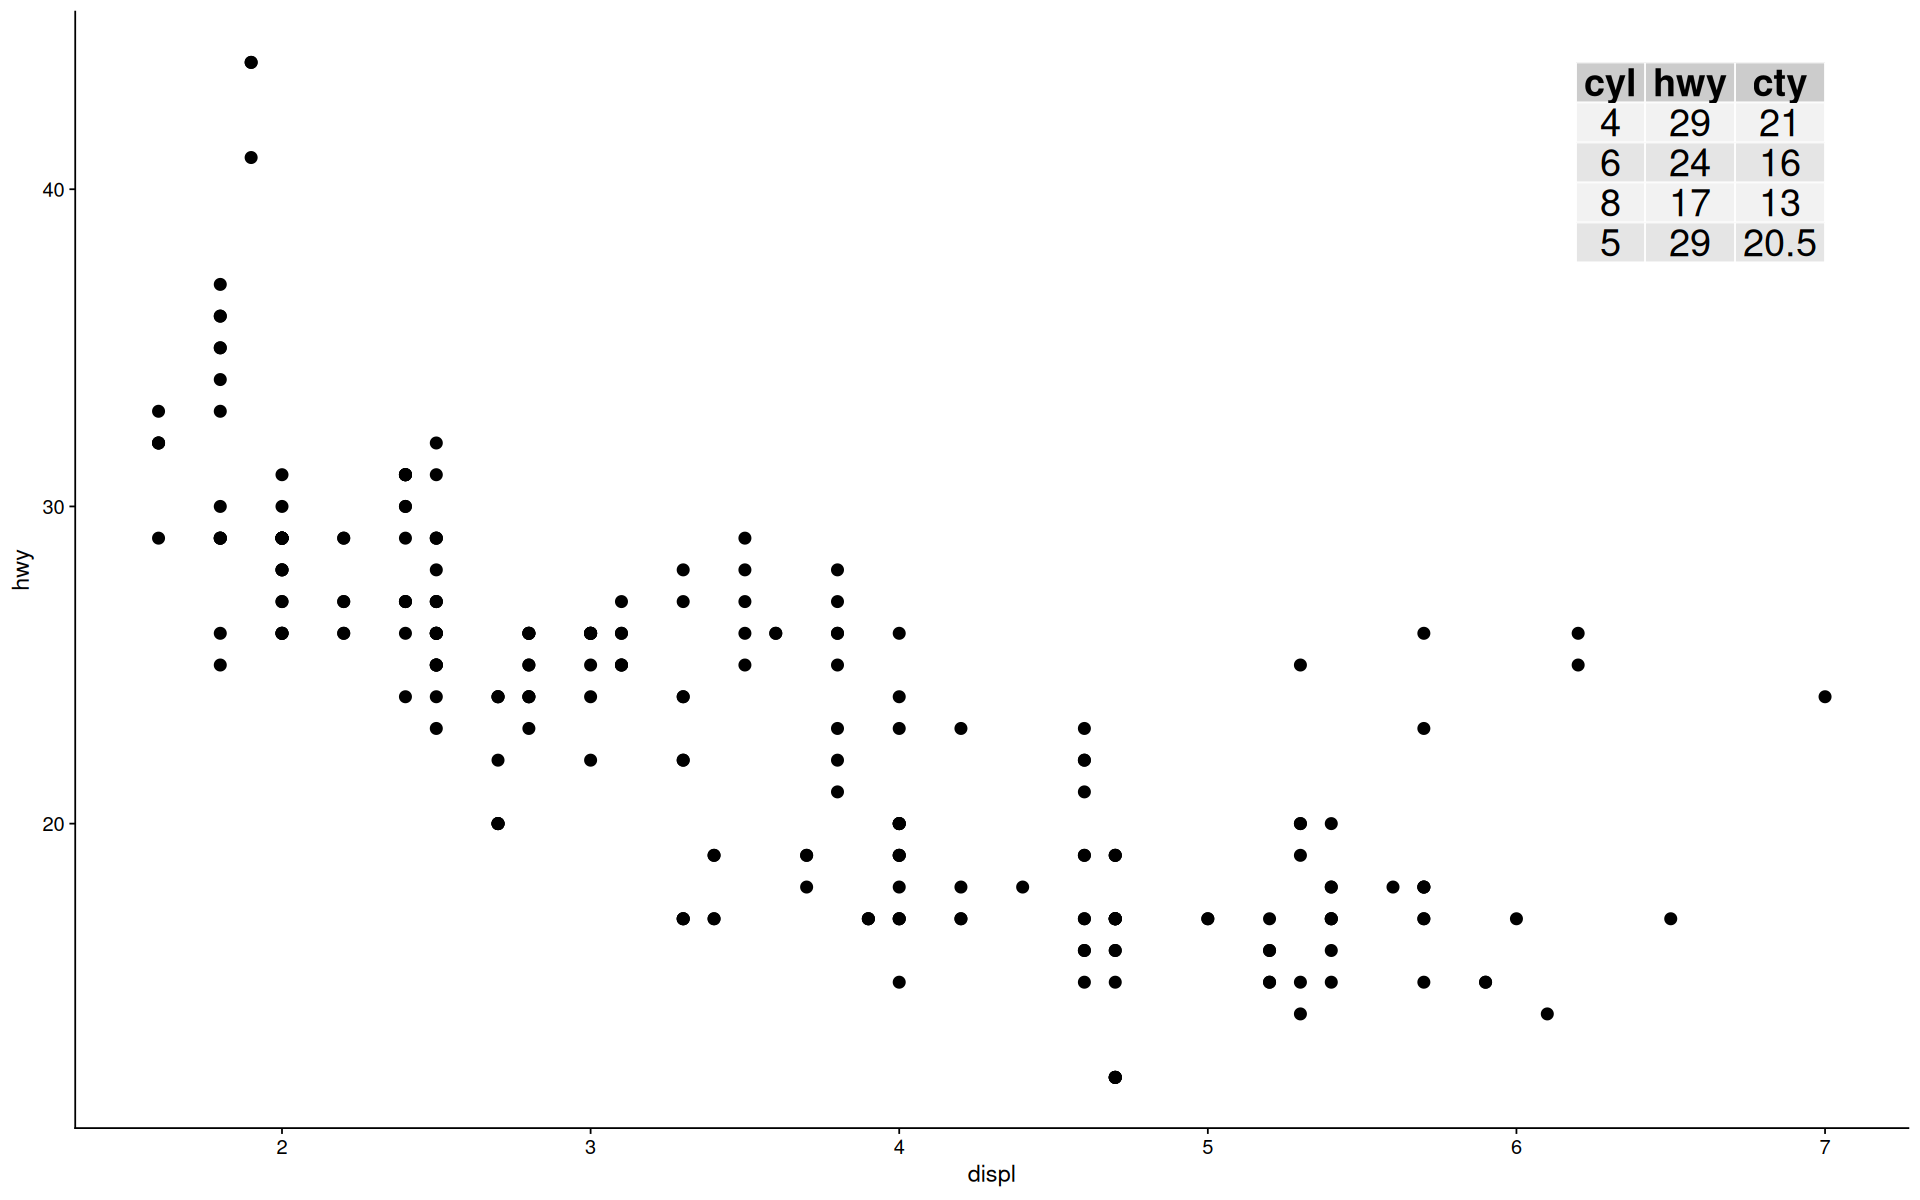
Plot zoom
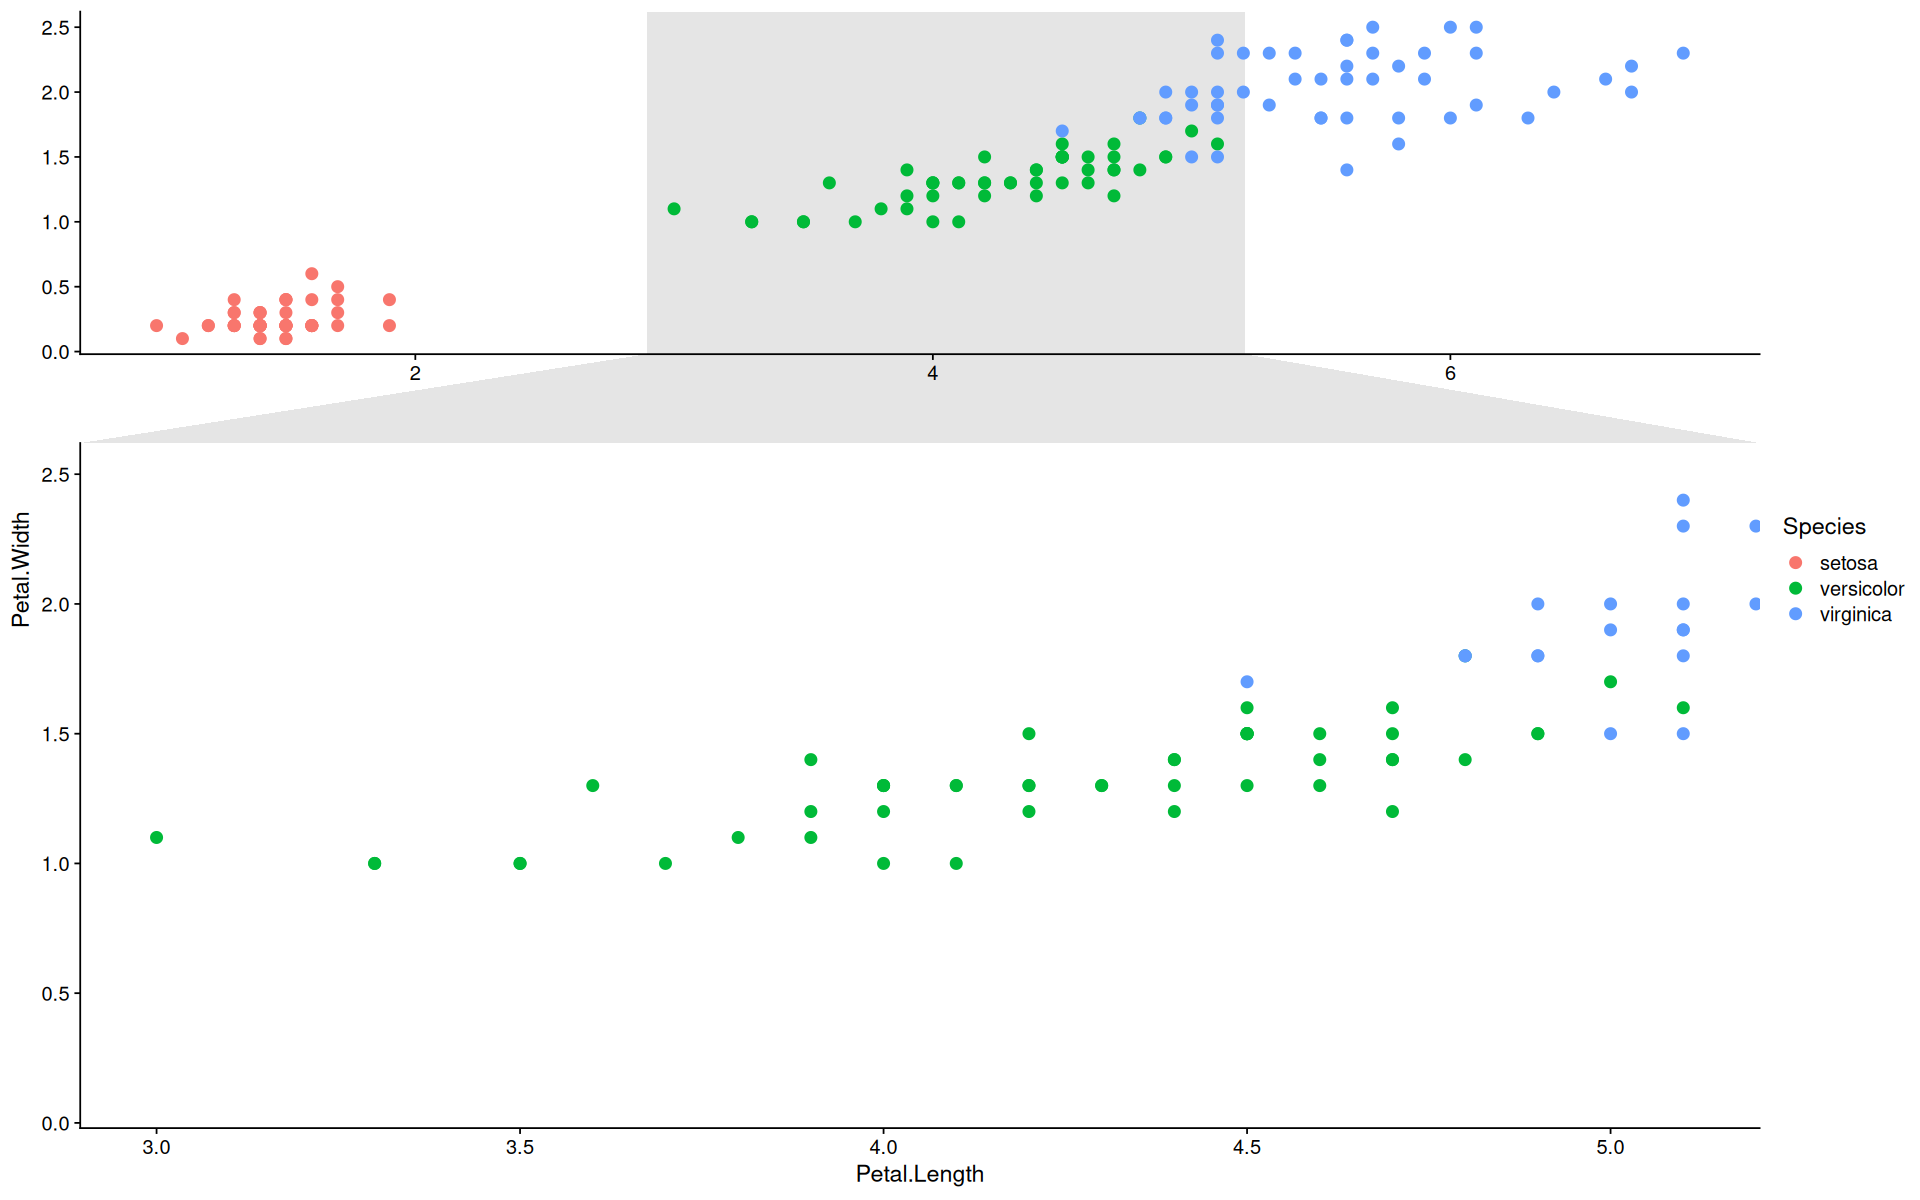
library(ggforce)ggplot(iris, aes(Petal.Length, Petal.Width, colour = Species)) +
geom_point(size=3) +
facet_zoom(x = Species == "versicolor")